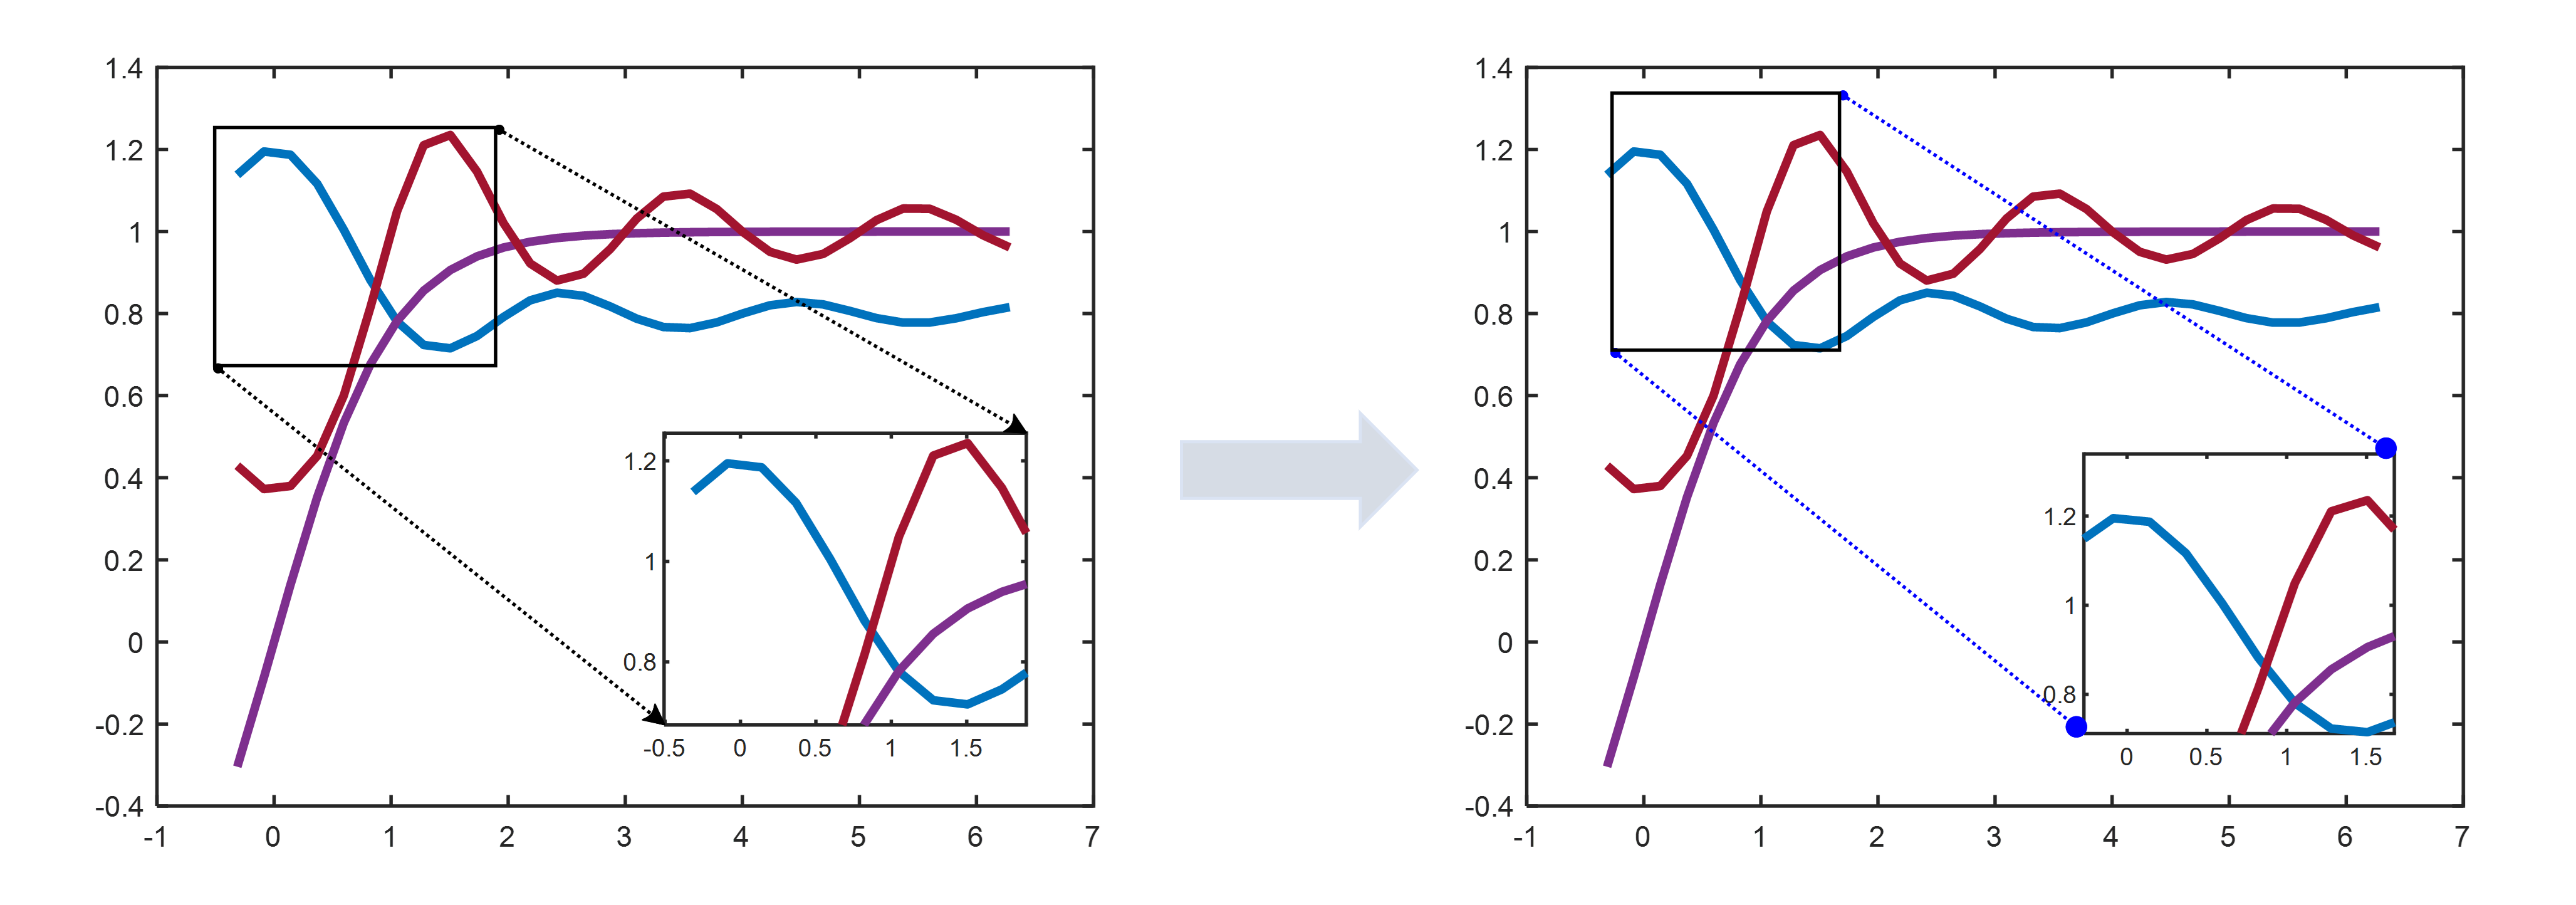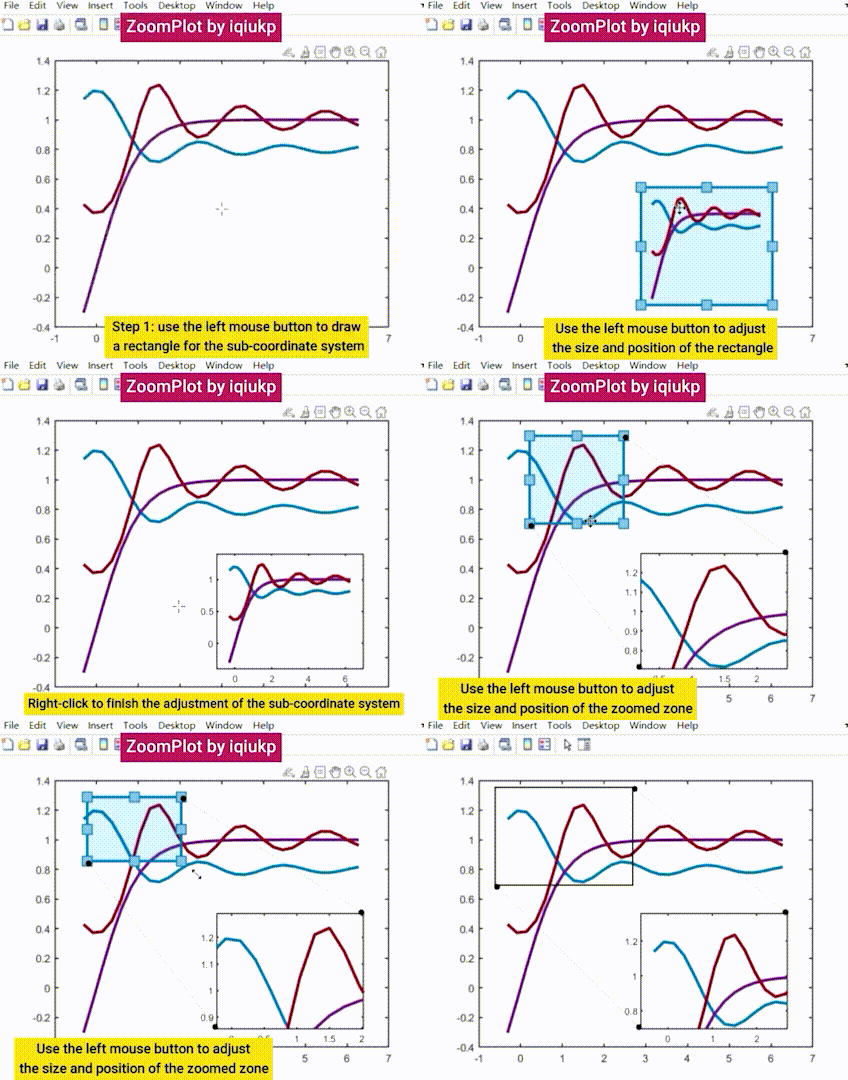
MATLAB Code for Interactive Magnification of Customized Regions.
Version 1.3, 17-JAN-2022
Email: iqiukp@outlook.com






- Easy application with just two lines of code
- Interactive plotting
- Support for image and figure classes
- Support for multiple zoomed zones
- Custom settings of parameters and themes
- R2014b and later releases
- Image Processing Toolbox
- Add
BaseZoom.mfile to MATLAB search path or current working directory - After completing the basic drawing, enter the following two lines of code in the command line window or your m-file:
% add a zoomed zone
zp = BaseZoom();
zp.plot;
if multiple zoomed zones are required, for example, 3 zoomed zones, the code are as follows:
% add 3 zoomed zones
zp = BaseZoom();
zp.plot;
zp.plot;
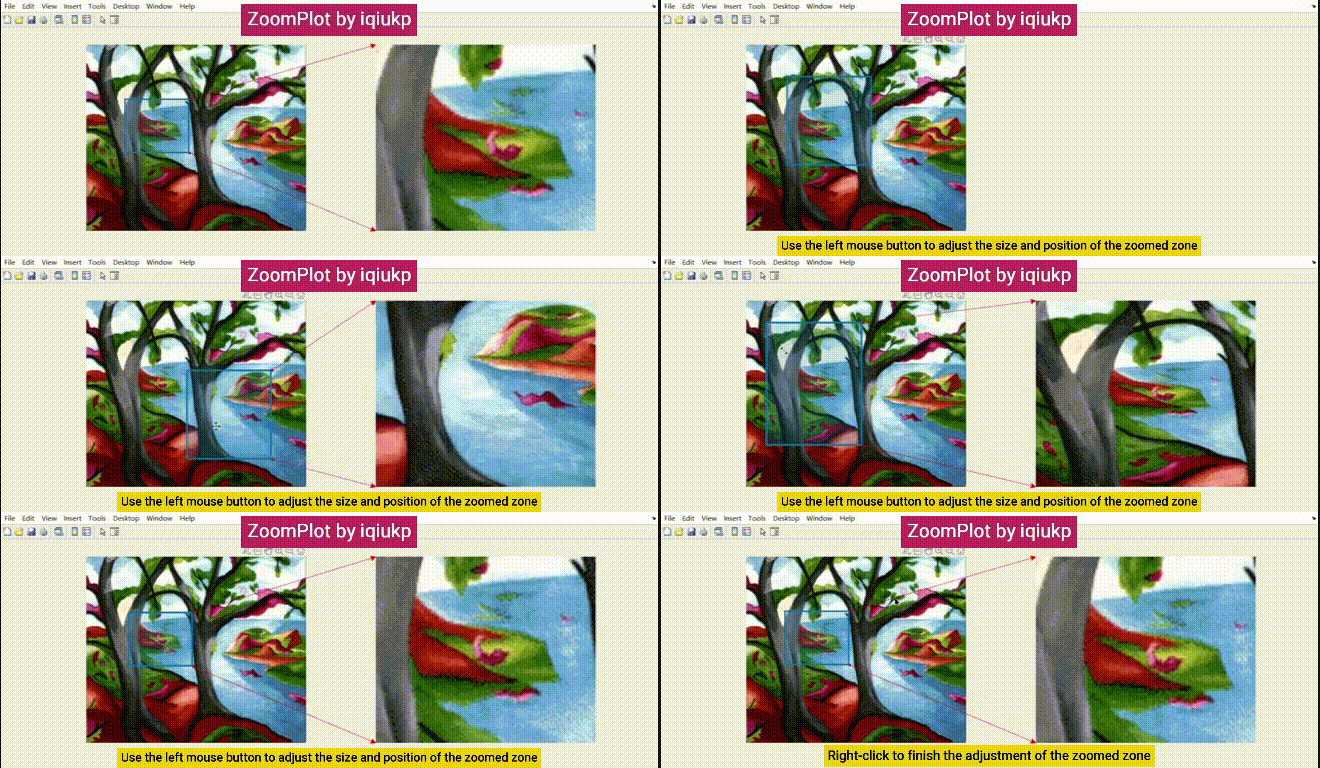
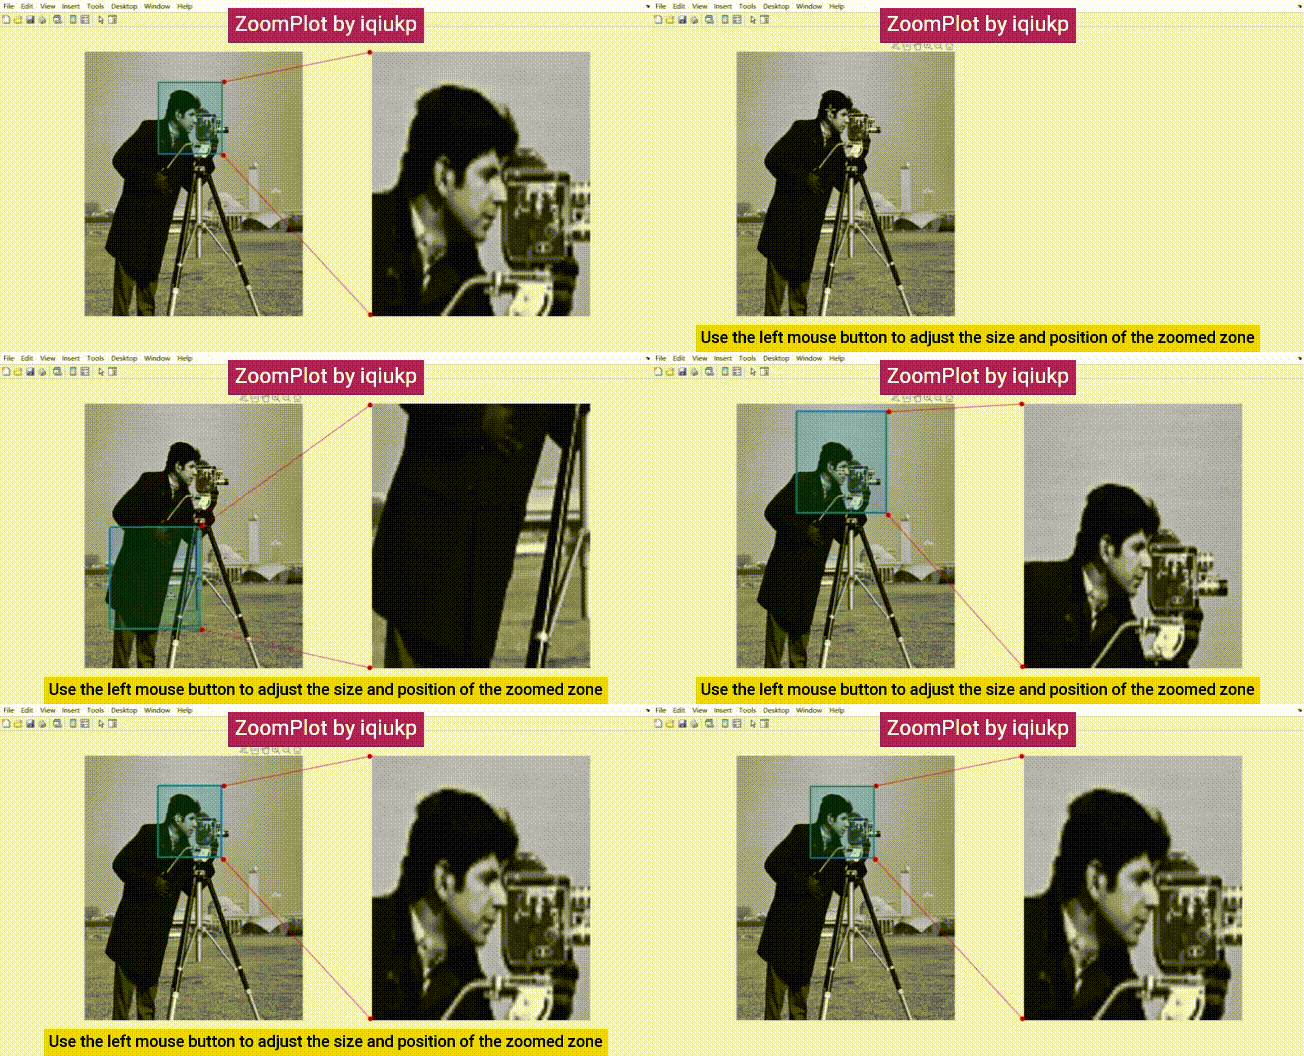
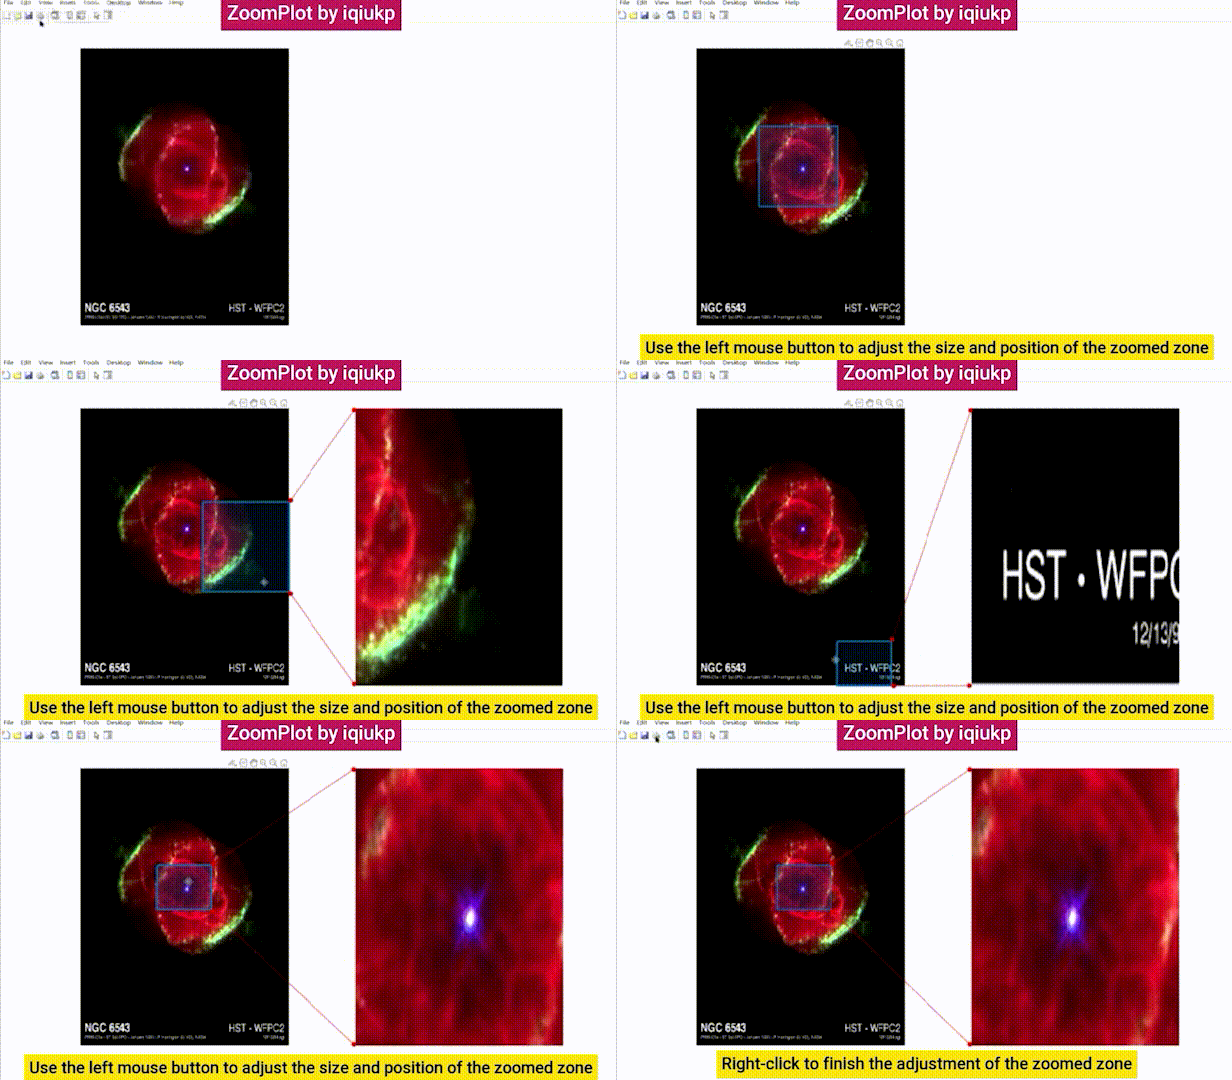
zp.plot;Multiple types of image are supported for interactive magnification of customized regions in the ZoomPlot.
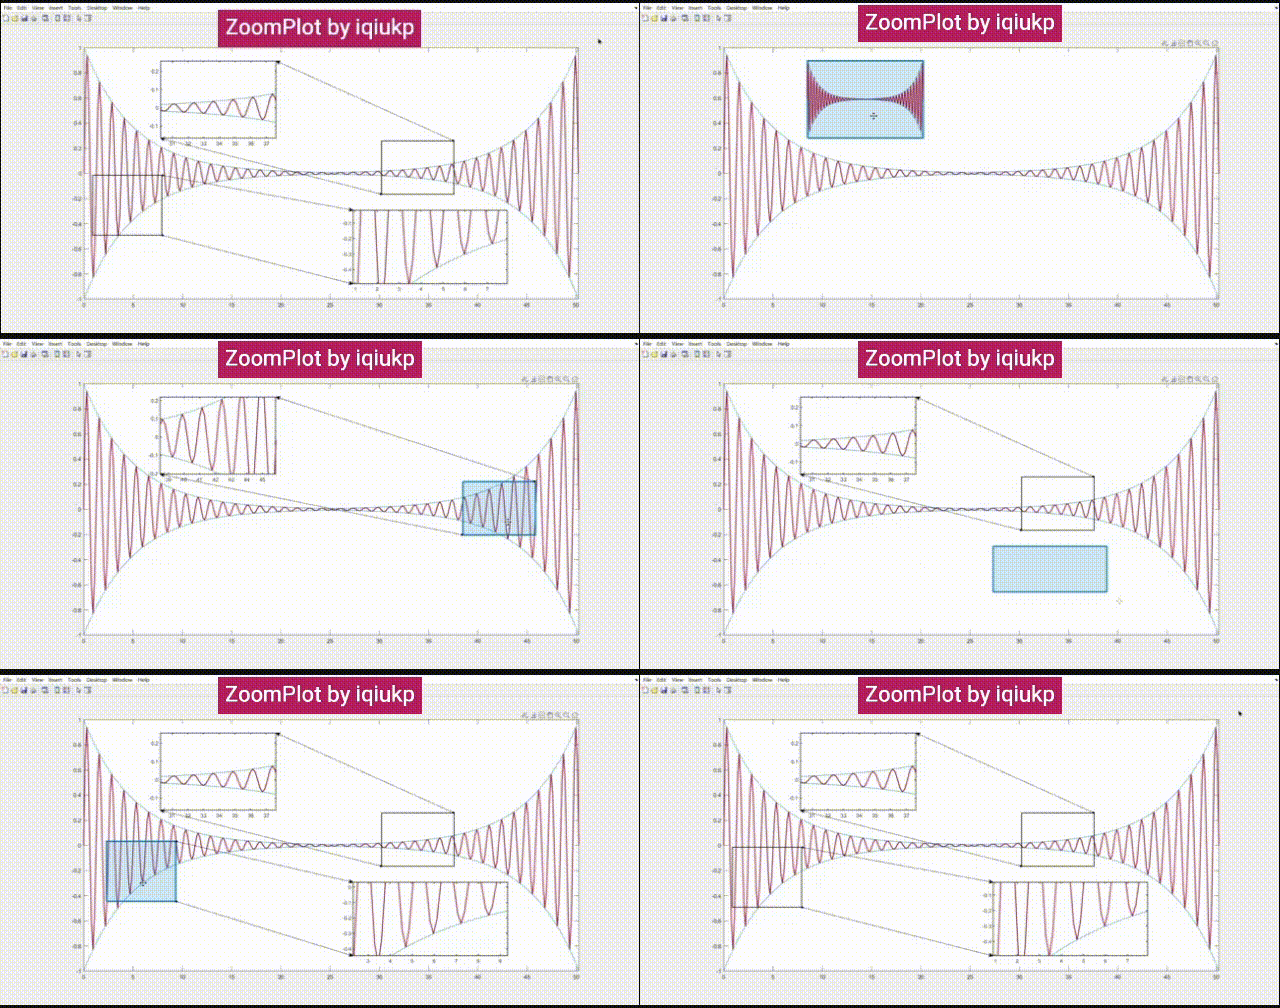
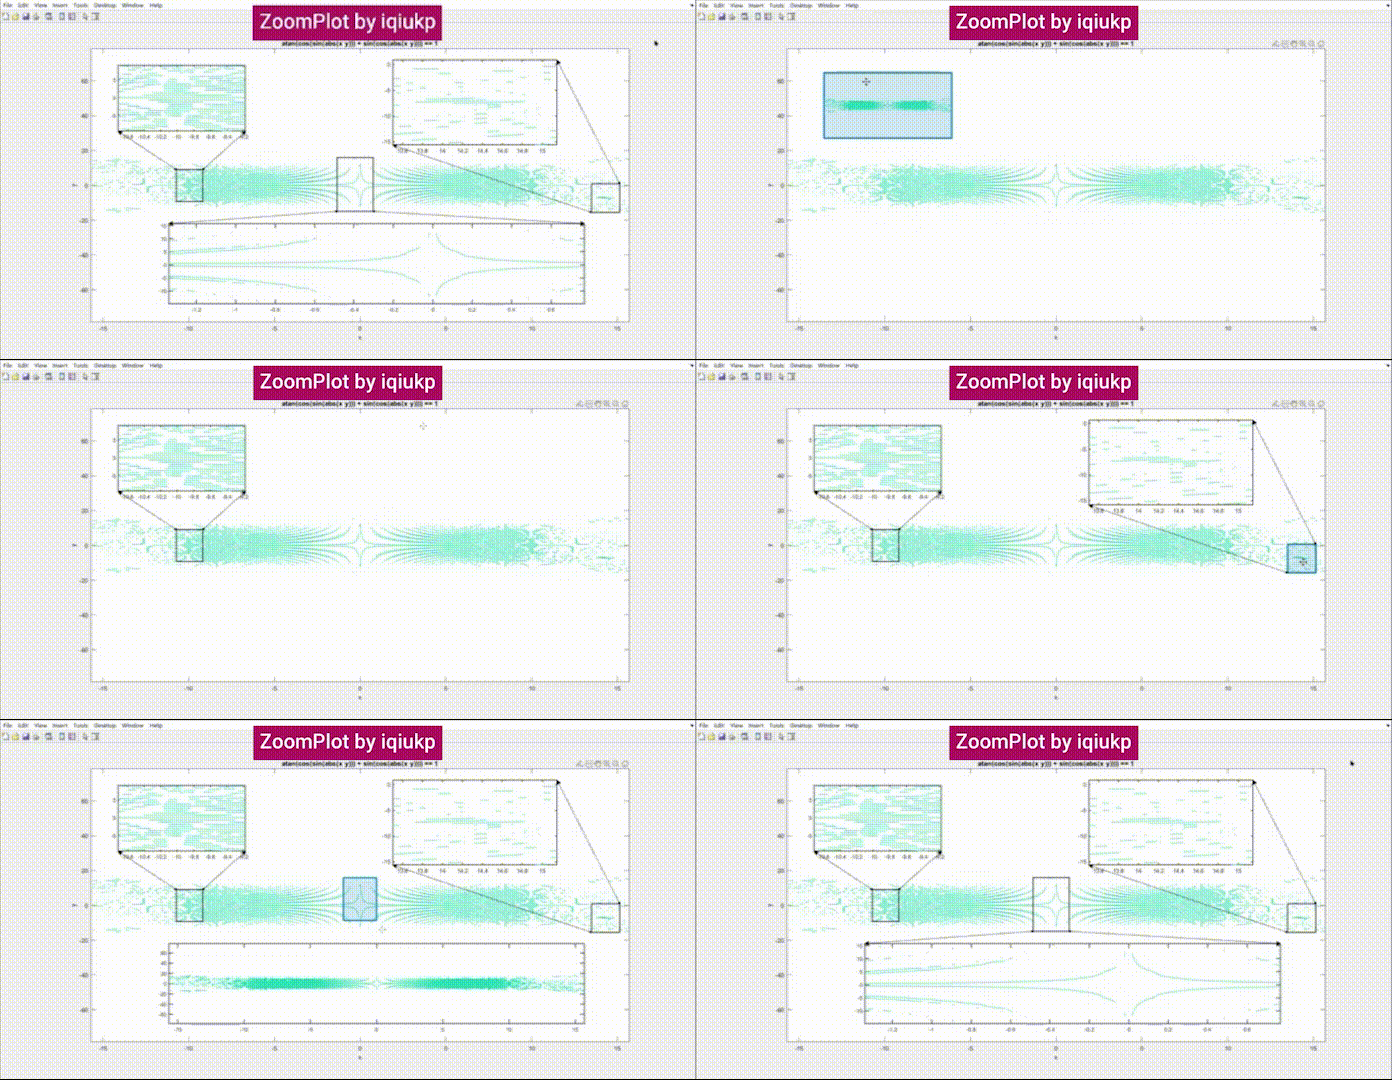
Multiple zoomed zones are supported for figure class.
Just modify the properties of the BaseZoom class file. The default properties are:
    % theme of inserted axes (sub-axes)
    properties
        subAxesBox = 'on'
        subAxesinsertedLineWidth = 1.2
        subAxesTickDirection = 'in'
        subAxesBackgroundColor = 'w'
    end
For example, remove the border of the sub-coordinate system and set the line width to 3:
    % theme of inserted axes (sub-axes)
    properties
        subAxesBox = 'off'
        subAxesinsertedLineWidth = 3
        subAxesTickDirection = 'in'
        subAxesBackgroundColor = 'w'
    end
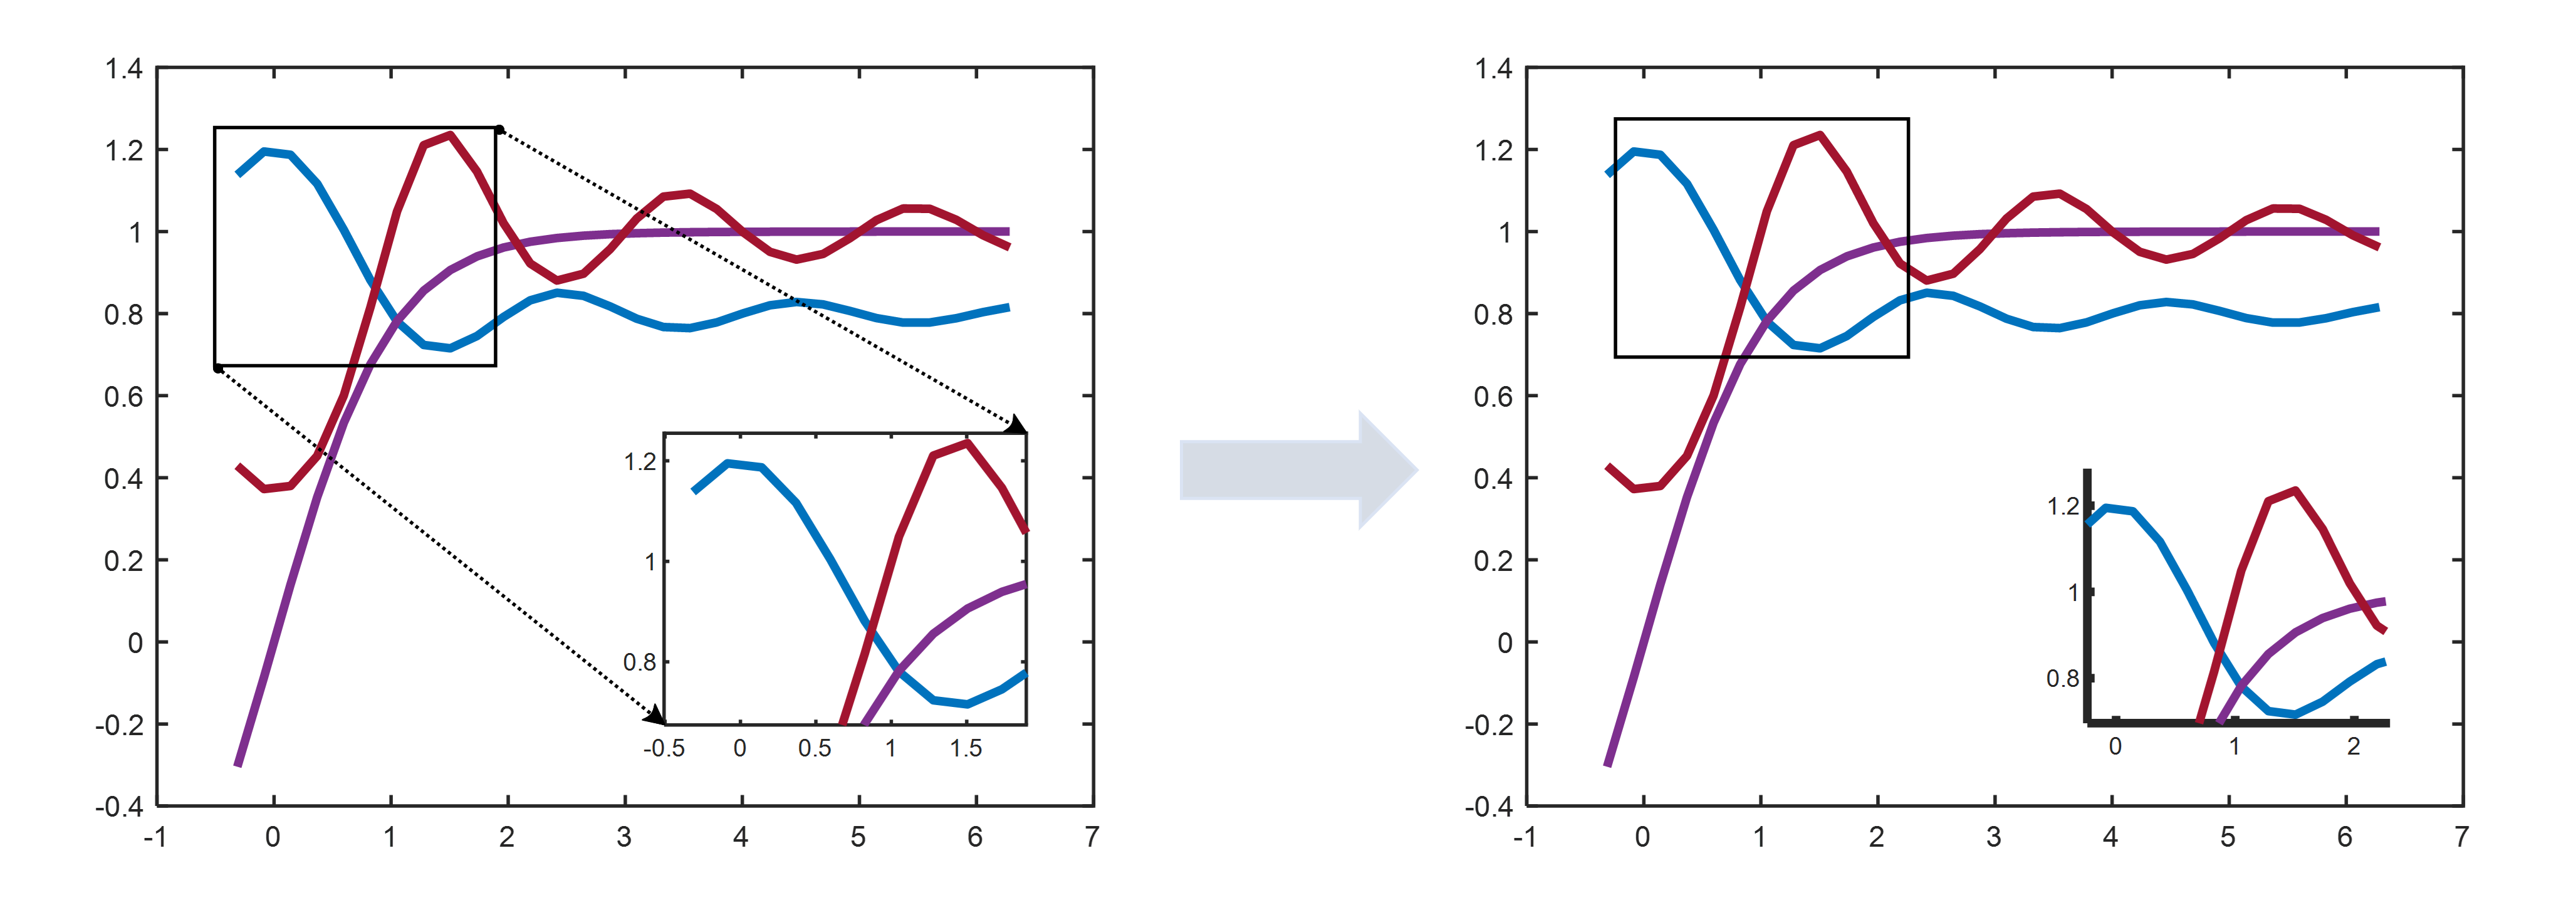
Just modify the properties of the BaseZoom class file. The default properties are:
    % theme of the zoomed zone (figures)
    properties
        rectangleColor = 'k'
        rectangleFaceColor = 'none'
        rectangleFaceAlpha = 0
        rectangleLineStyle = '-'
        rectangleLineWidth = 1.2
        rectangleInteractionsAllowed = 'none'
    end
For example, set the line color to red and the line width to 2:
    % theme of the zoomed zone (figures)
    properties
        rectangleColor = 'r'
        rectangleFaceColor = 'none'
        rectangleFaceAlpha = 0
        rectangleLineStyle = '-'
        rectangleLineWidth = 2
        rectangleInteractionsAllowed = 'none'
    end
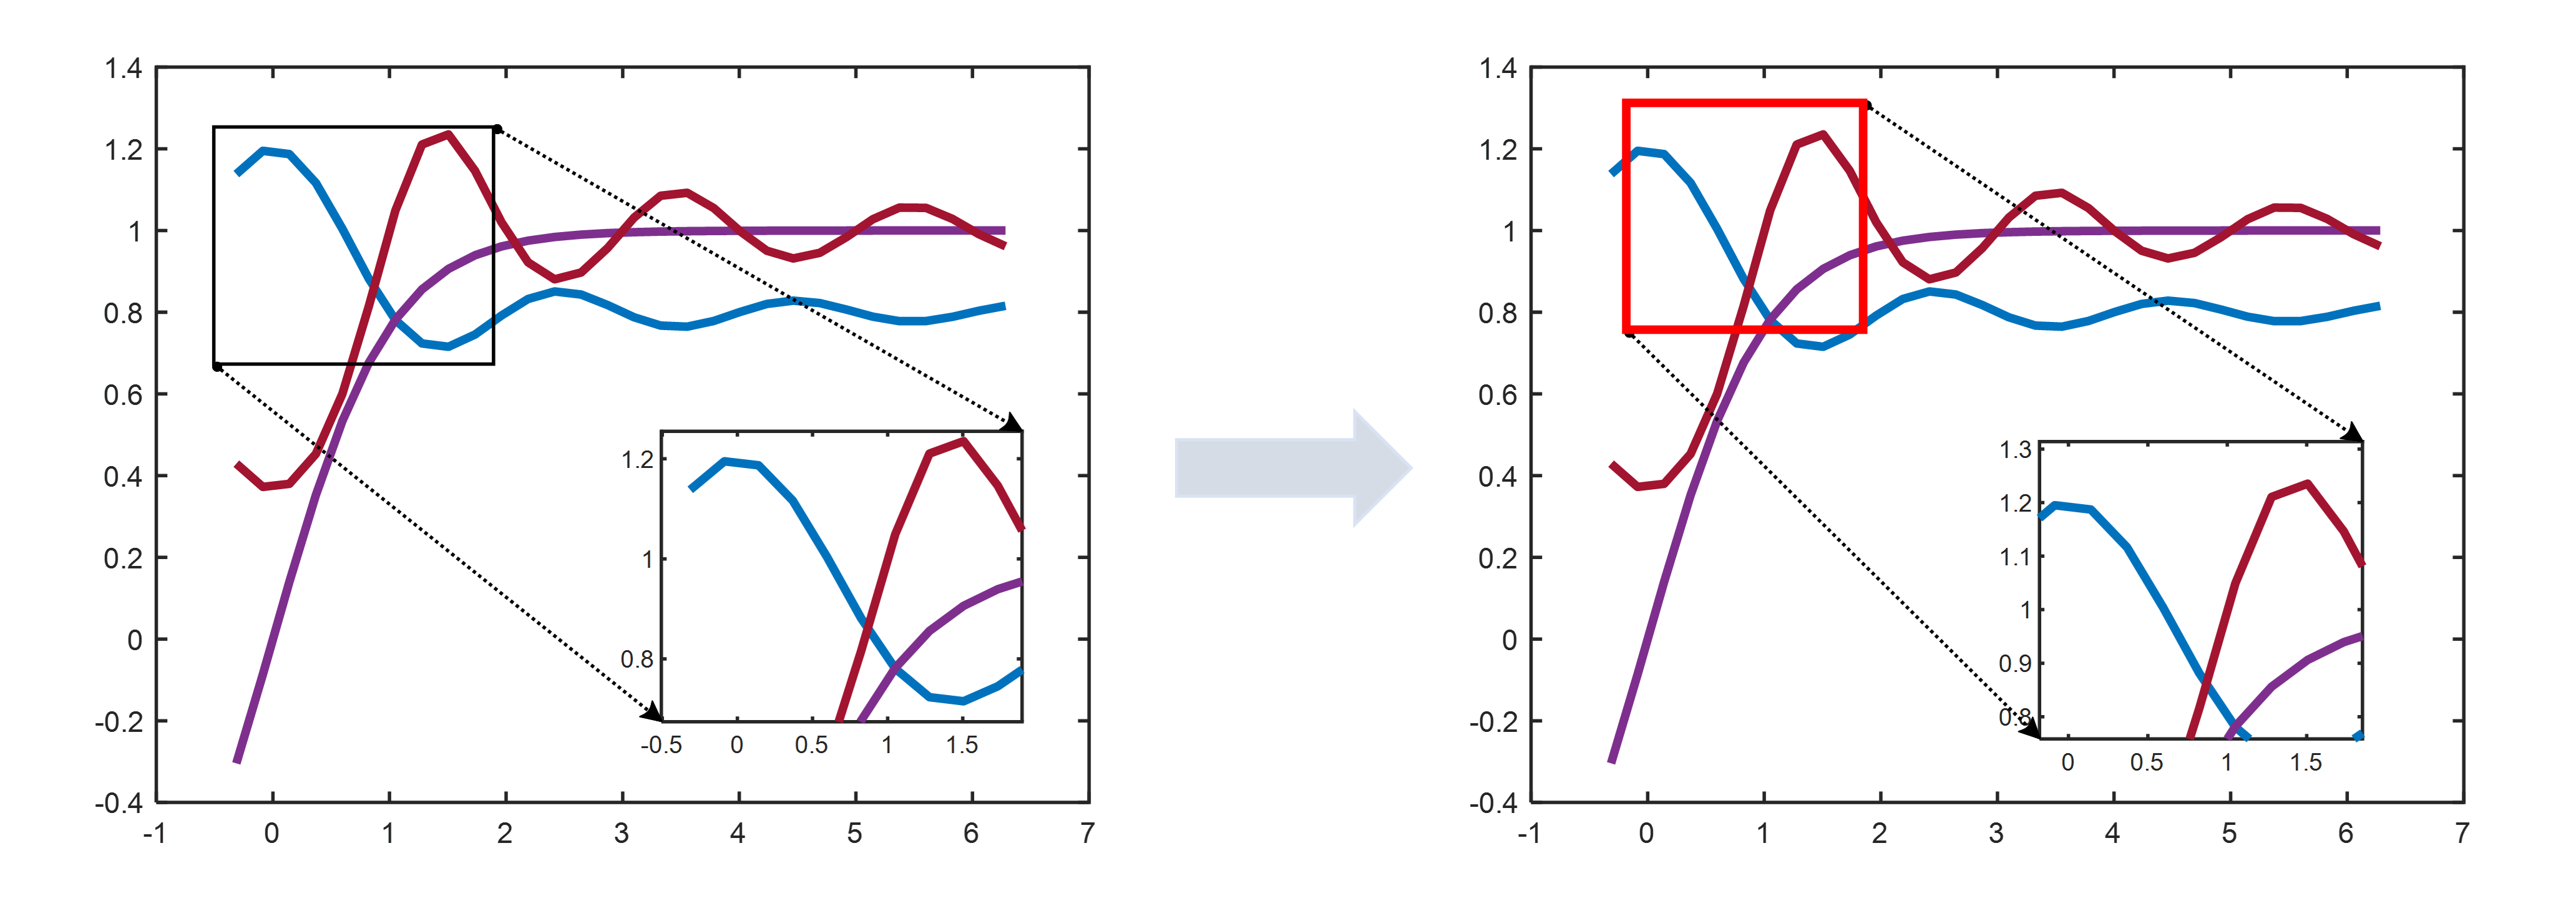
Just modify the properties of the BaseZoom class file. The default properties are:
    % theme of the connected lines (figures)
    properties
        % setting of lines between arrows
        figureConnectedLineStyle = ':'
        figureConnectedLineColor = 'k'
        figureConnectedLineWidth = 1.2
        % setting of start arrow
        figureConnectedLineStartHeadStyle = 'ellipse' % shape of start arrow
        figureConnectedLineStartHeadLength = 3
        figureConnectedLineStartHeadWidth = 3
        % setting of end arrow
        figureConnectedLineEndHeadStyle = 'cback2' % shape of ending arrow
        figureConnectedLineEndHeadLength = 7
        figureConnectedLineEndHeadWidth = 7
    end
For example, set the shape of ending arrow to 'ellipse' and the line color to 'b':
    % theme of the connected lines (figures)
    properties
        % setting of lines between arrows
        figureConnectedLineStyle = ':'
        figureConnectedLineColor = 'r'
        figureConnectedLineWidth = 1.2
        % setting of start arrow
        figureConnectedLineStartHeadStyle = 'ellipse' % shape of start arrow
        figureConnectedLineStartHeadLength = 3
        figureConnectedLineStartHeadWidth = 3
        % setting of end arrow
        figureConnectedLineEndHeadStyle = 'ellipse' % shape of ending arrow
        figureConnectedLineEndHeadLength = 7
        figureConnectedLineEndHeadWidth = 7
    end