

Name of Quantlet: Onchain Insights

Published in: Onchain Insights : a study of Decentralized finance metrics for stablecoin depeg risk

Description: This study focuses on extensive open-access data available on the blockchain, and its use to predict depeg risks for various stablecoins. In particular, we focus on the dynamics of the liquidity curve from Uniswap's popular v3 liquidity pool protocol, focusing on the dominant stablecoin pool, USDC-USDT.

Keywords: Cryptocurrency, Blockchain, Stablecoins, Decentralized Finance, Liquidity, Depeg risk

Author: Owen Chaffard

Submitted: 25.01.2026
Run this command to get up-to-date data:
bash update_data.shInstall python requirements:
pip install -r requirements.txtThis quantlet uses minute OHLC data from binance and block by block metrics on the USDE/USDT Uniswap liquidity pool to plot an animation higlighting the price divergence during the Ethena depeg event on October 10th 2025.
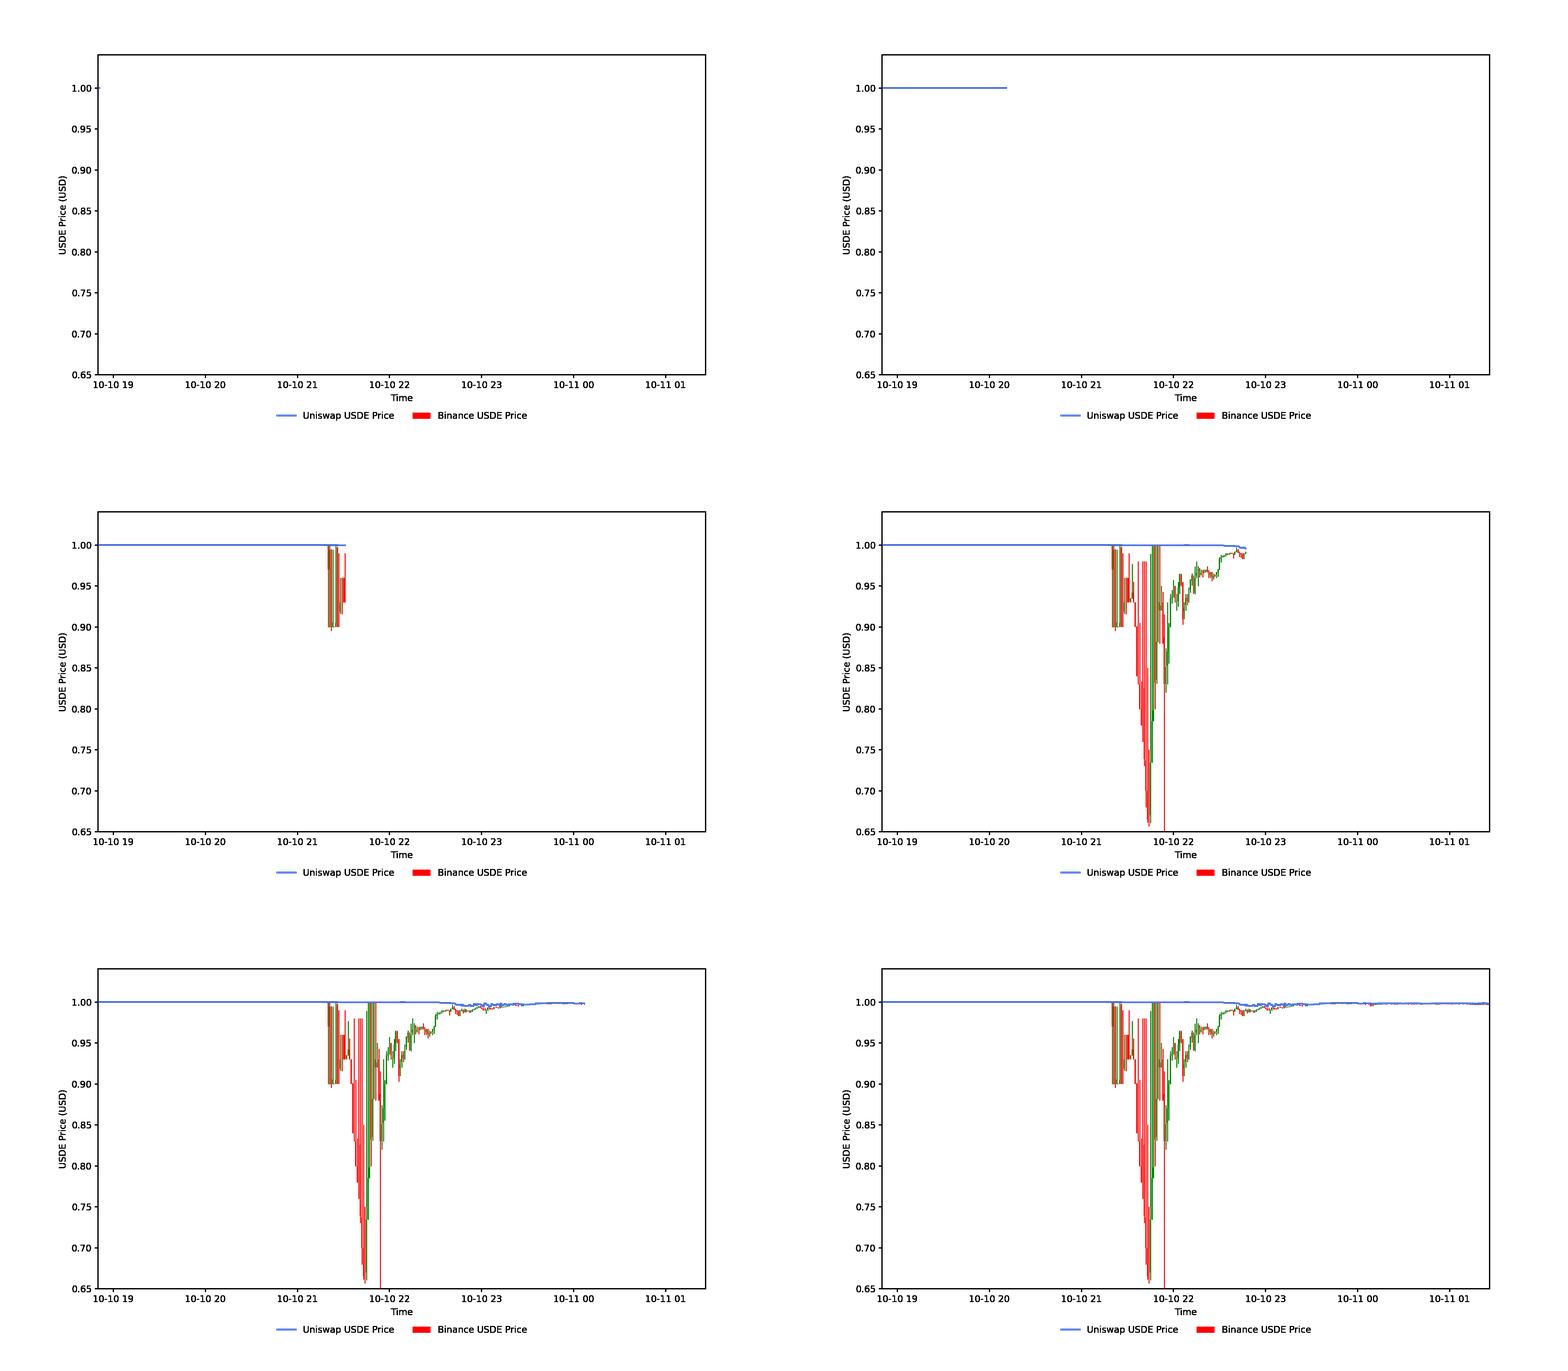
cd 1.\ USDE\ binance\ depeg/ ;
python plot_animation.pyThis quantlet explores the theoretical invariant curve for Curvefi's Stableswap pools. It plots the different invariant curves dpeneding on the amplification parameter, as well as historical partial quotes and pool imbalance.
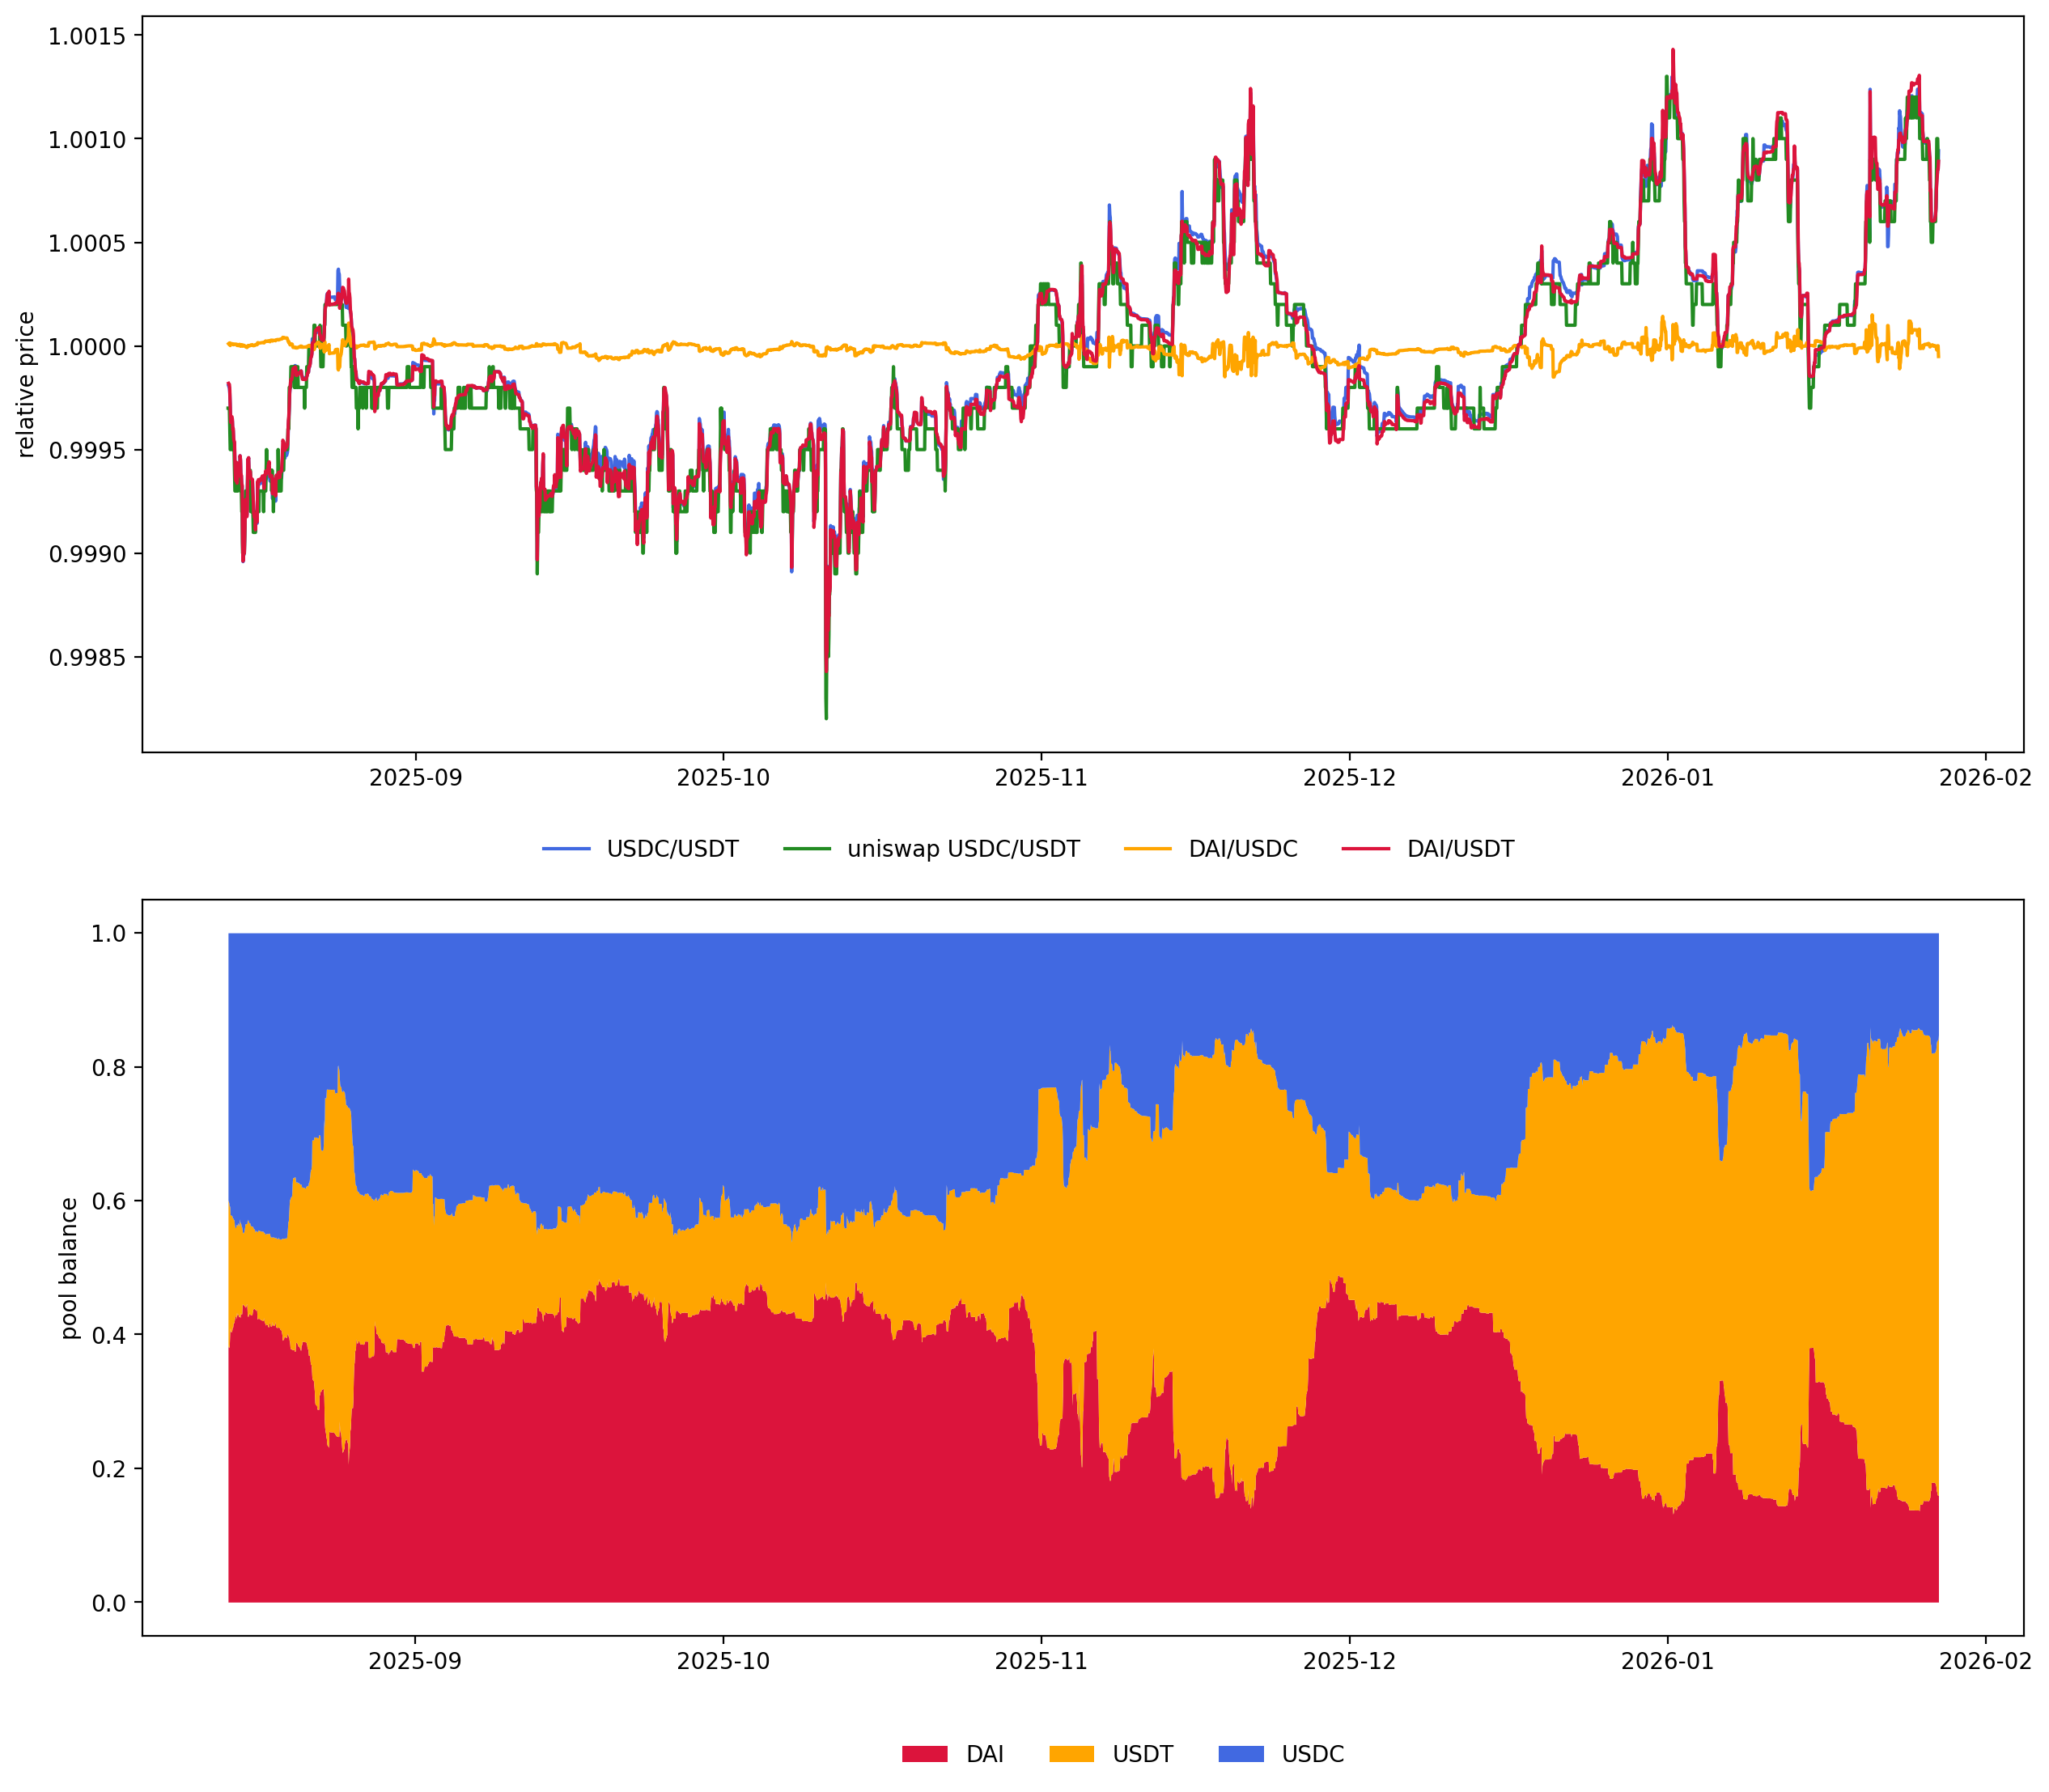
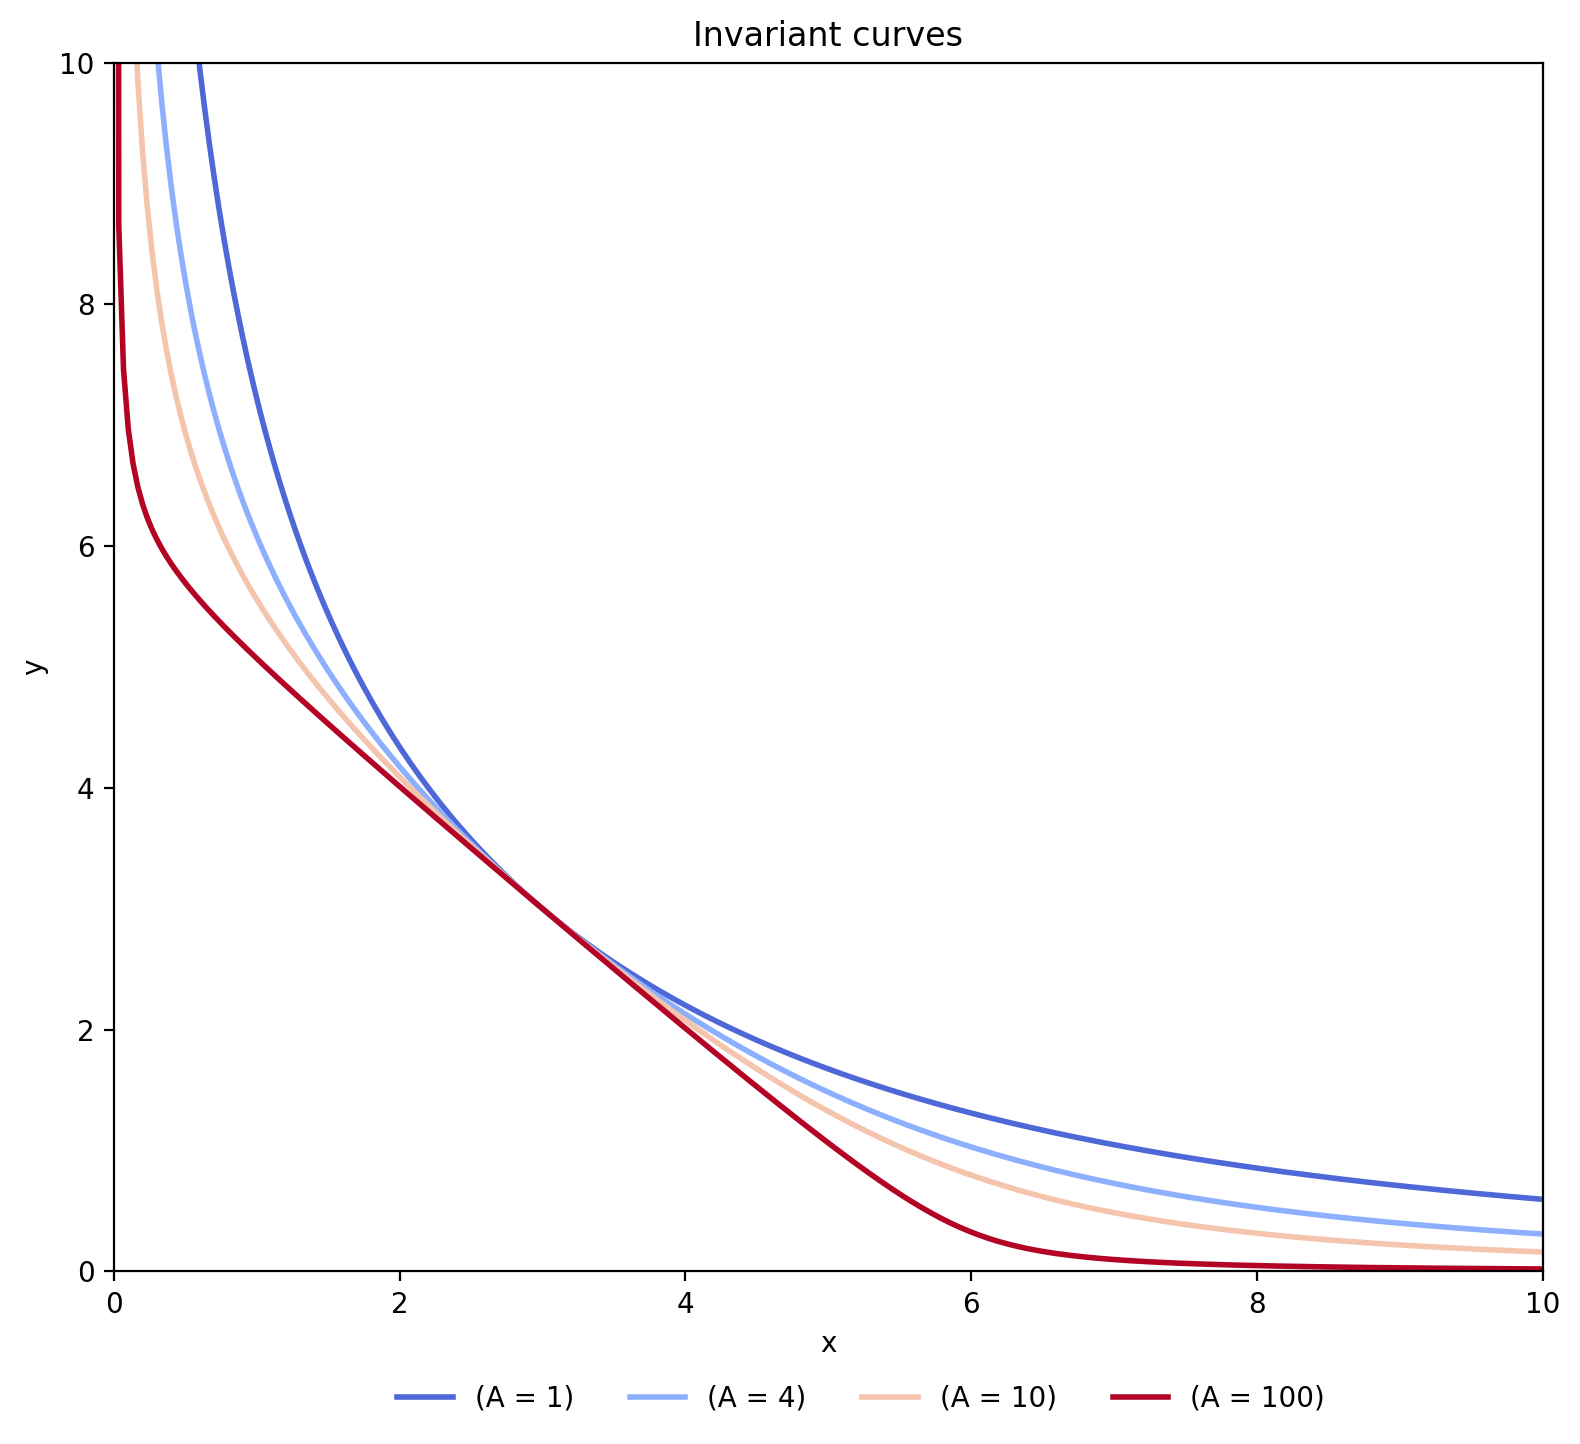
Run the notebook:
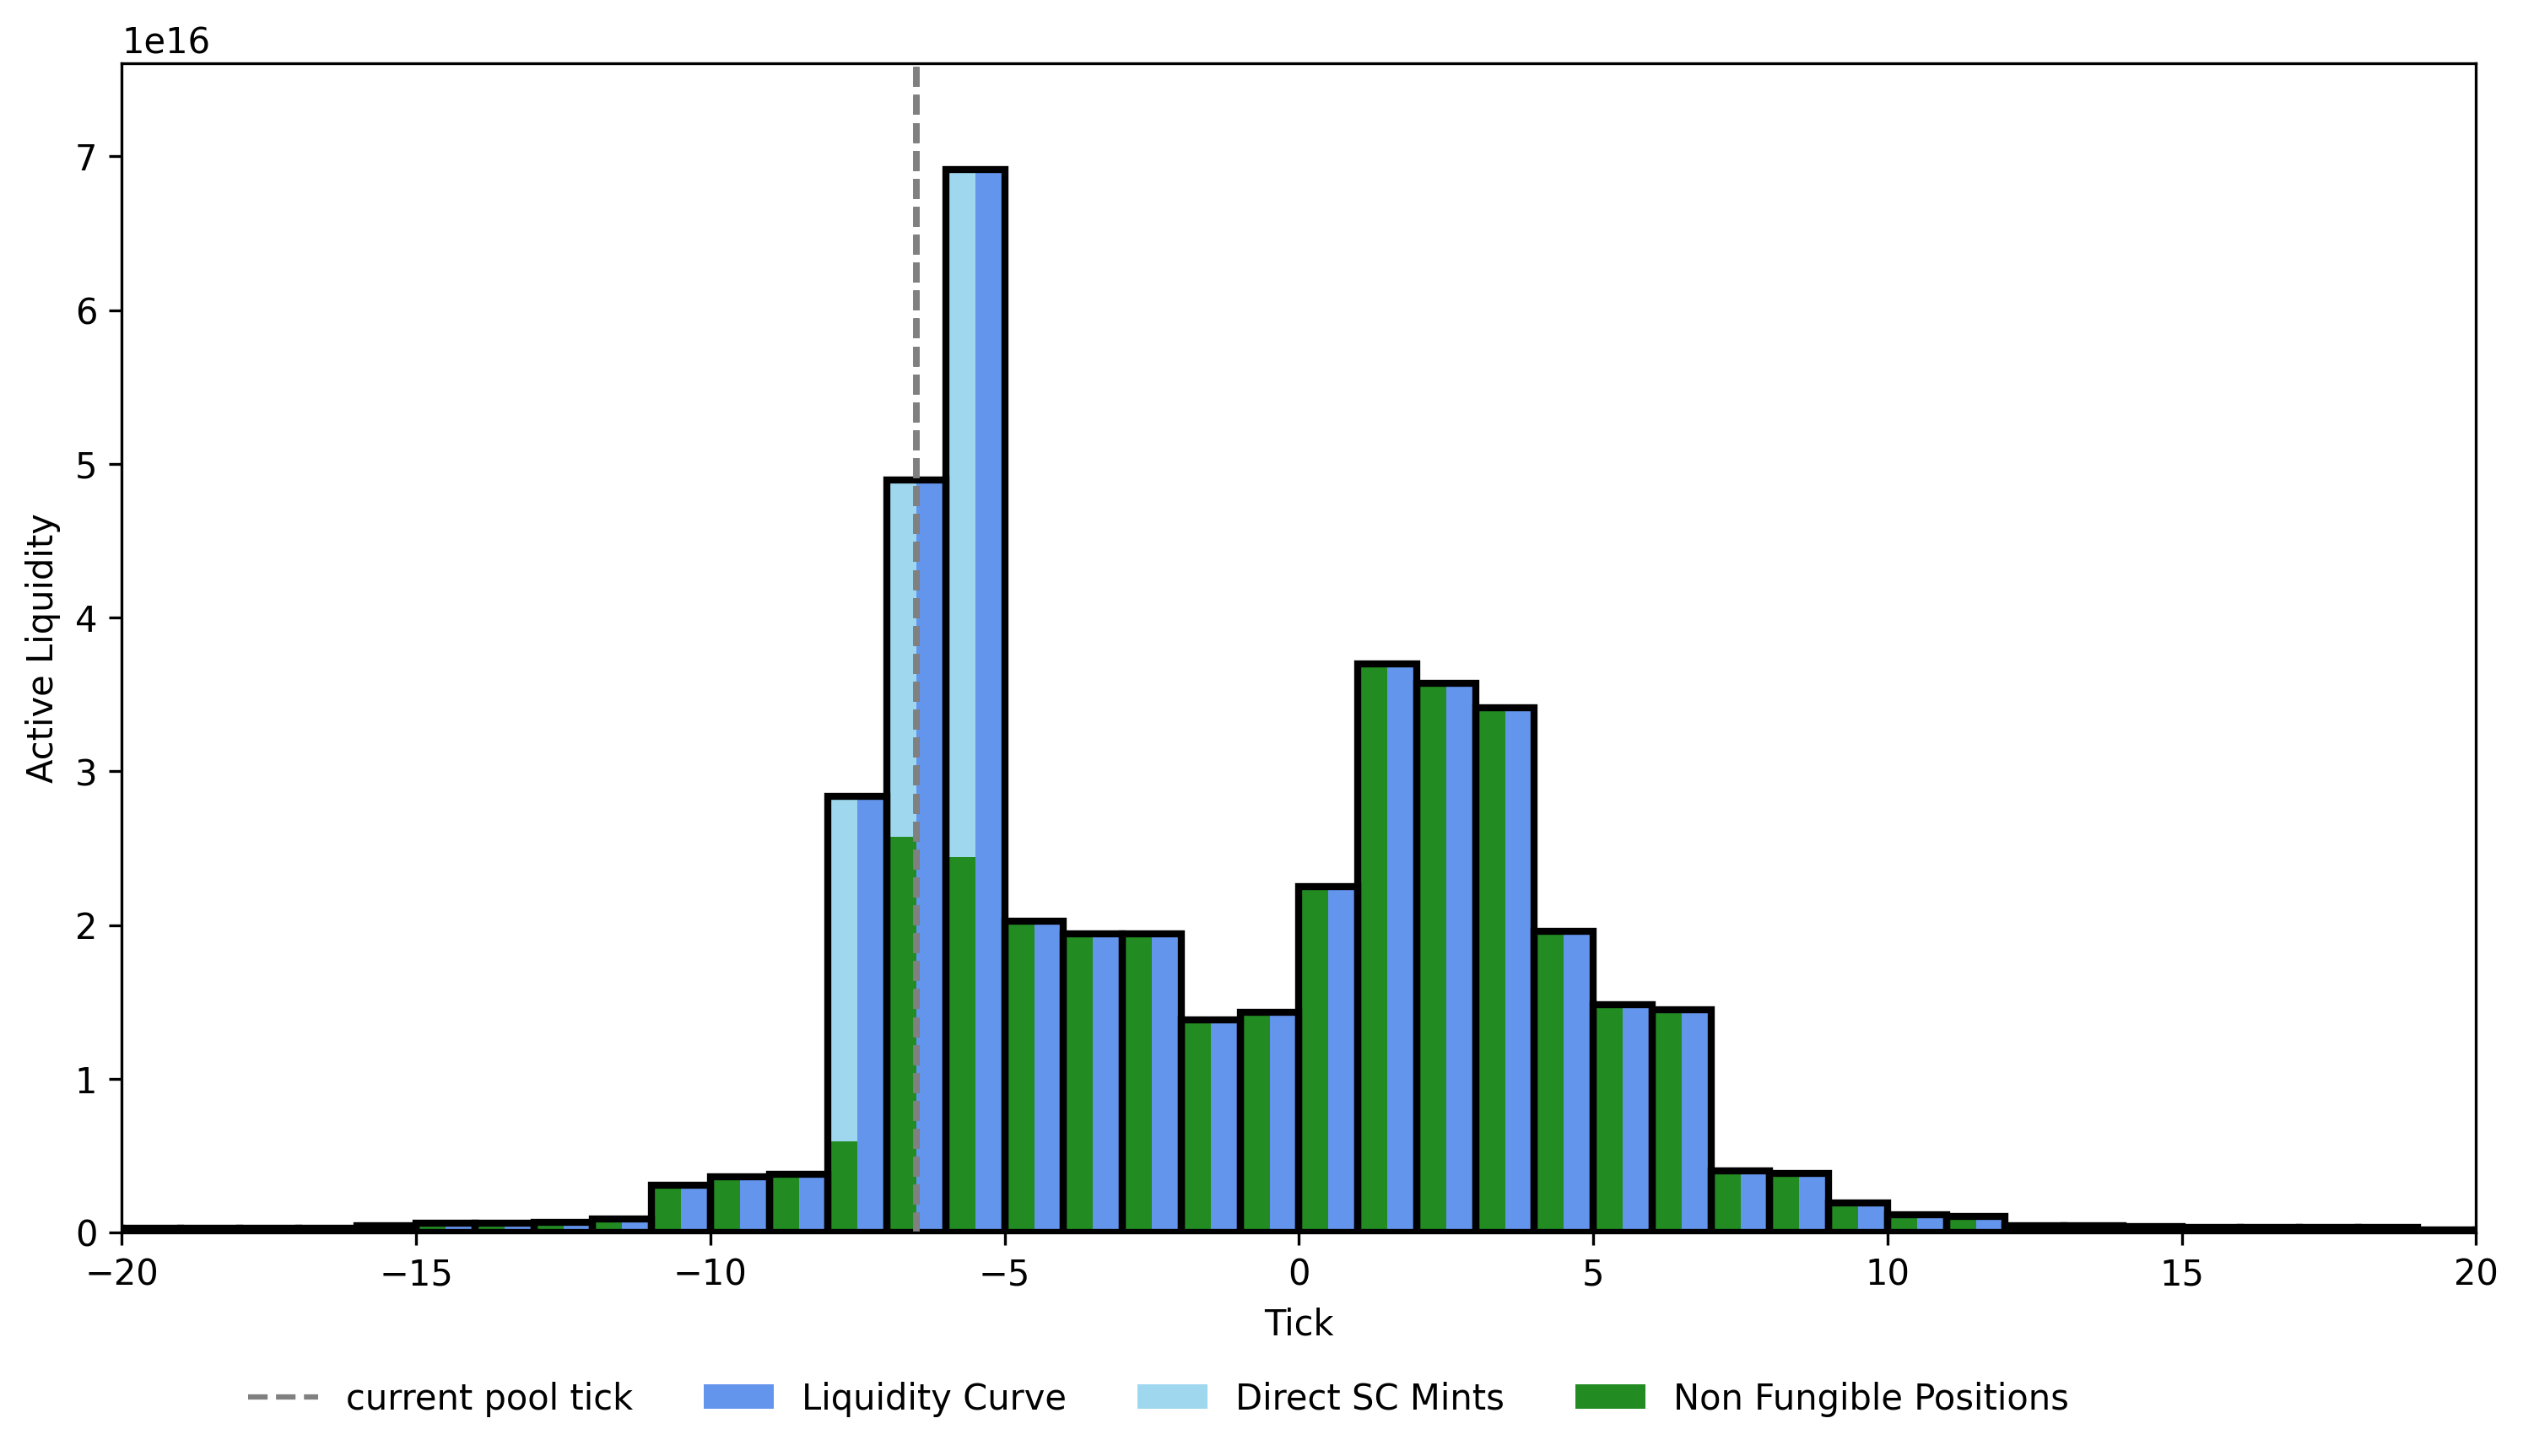
2. Curve liquidity pools/code.ipynbThis quantlet provides plots for viewing the time-varying liquidity distribution in the Uniswap v3 USDC-USDT pool. The liquidity curve is reconstructed from the Uniswap subgraph and we highlight its dynamics, as well as swap size impact curve, whicih are relevant to liqudiity risk for stablecoin depeg.
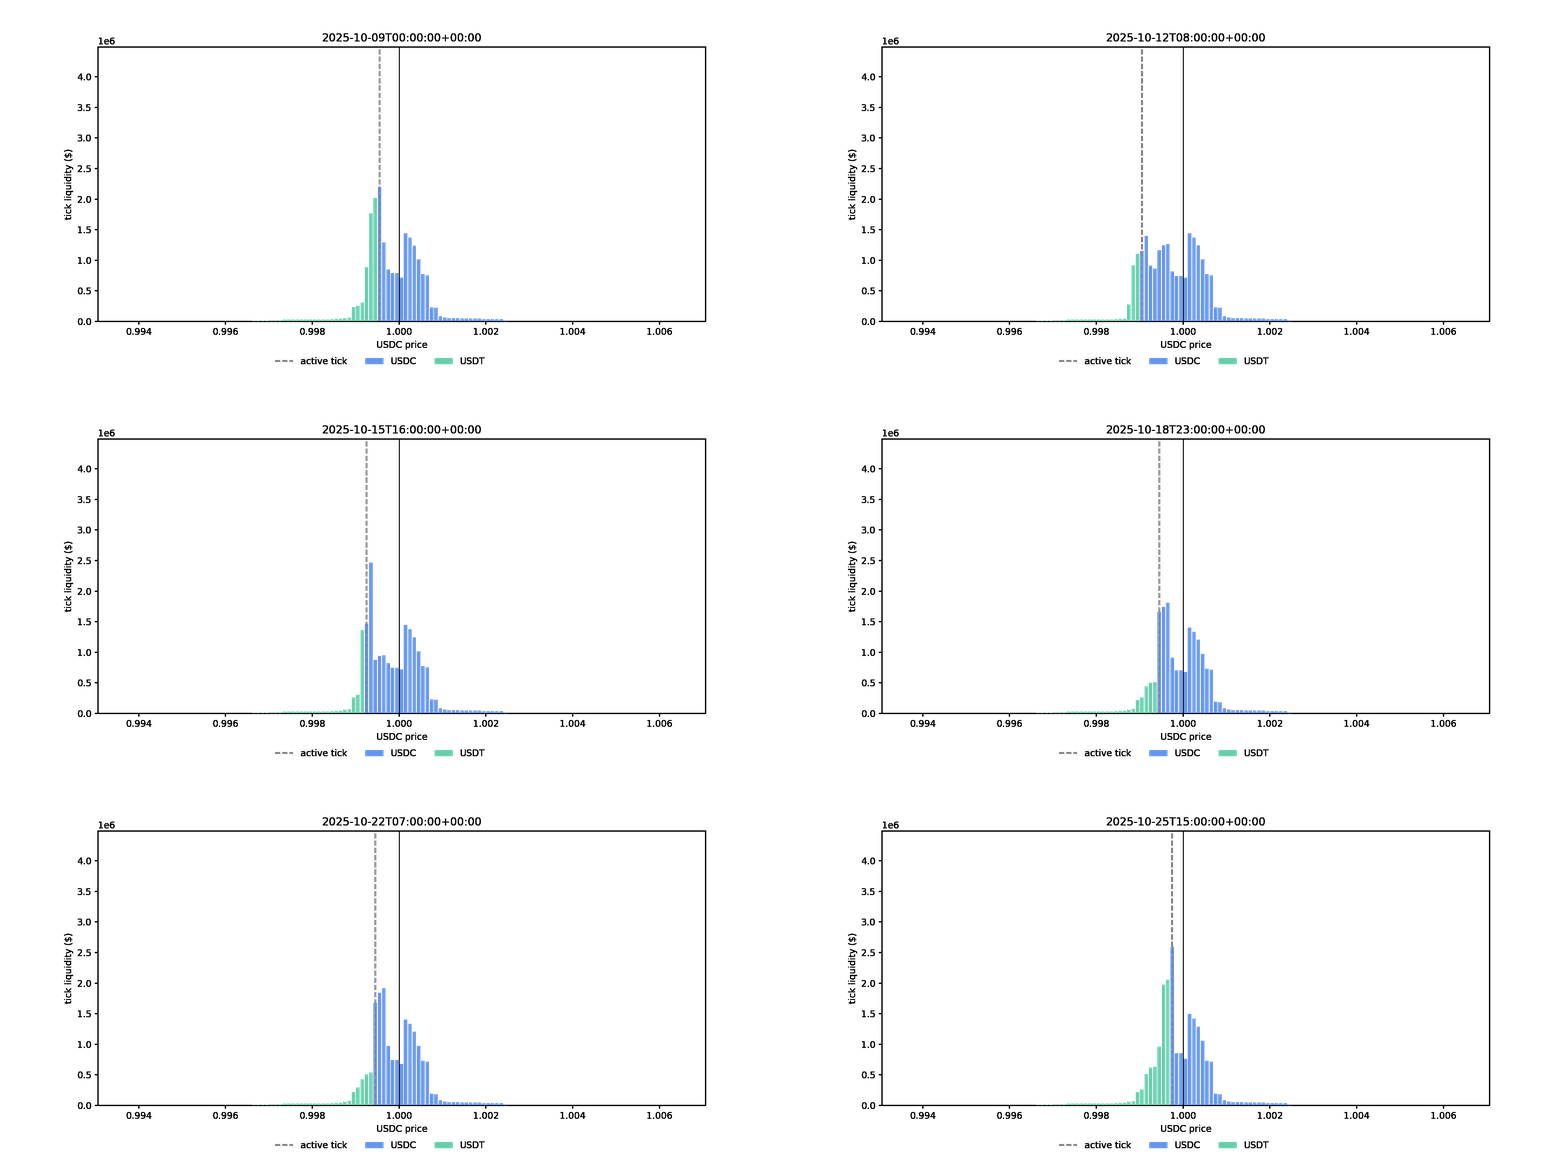
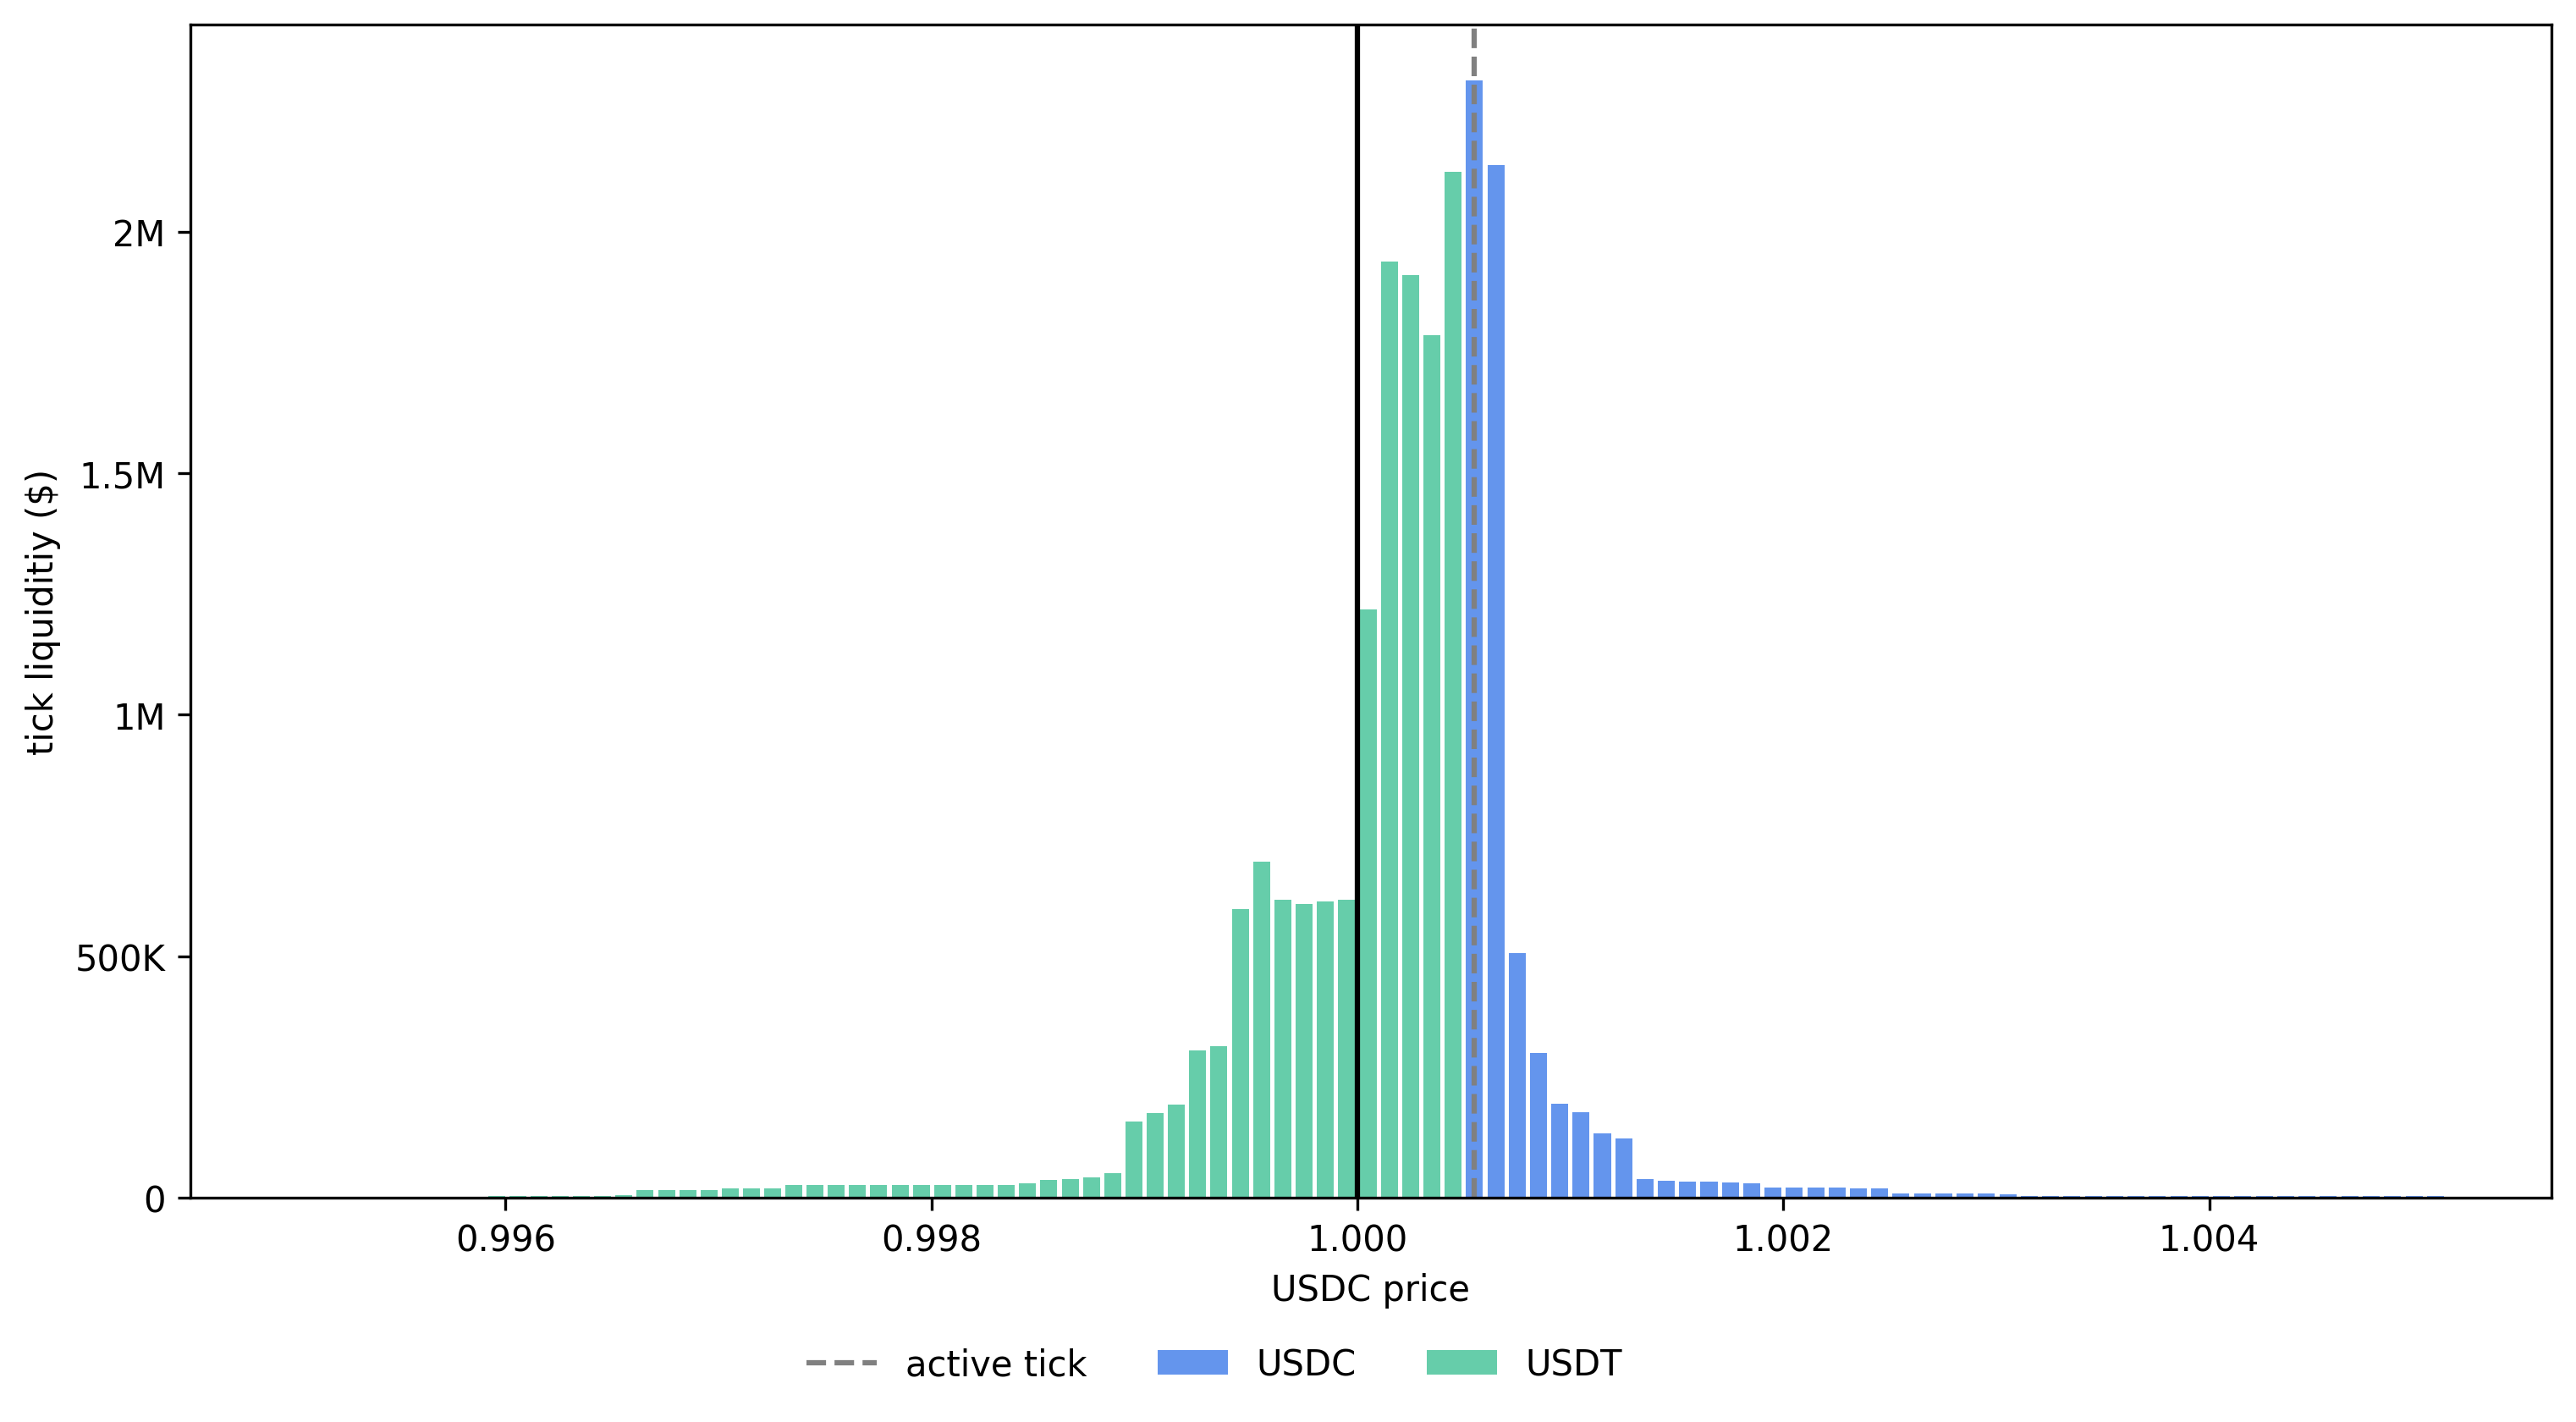
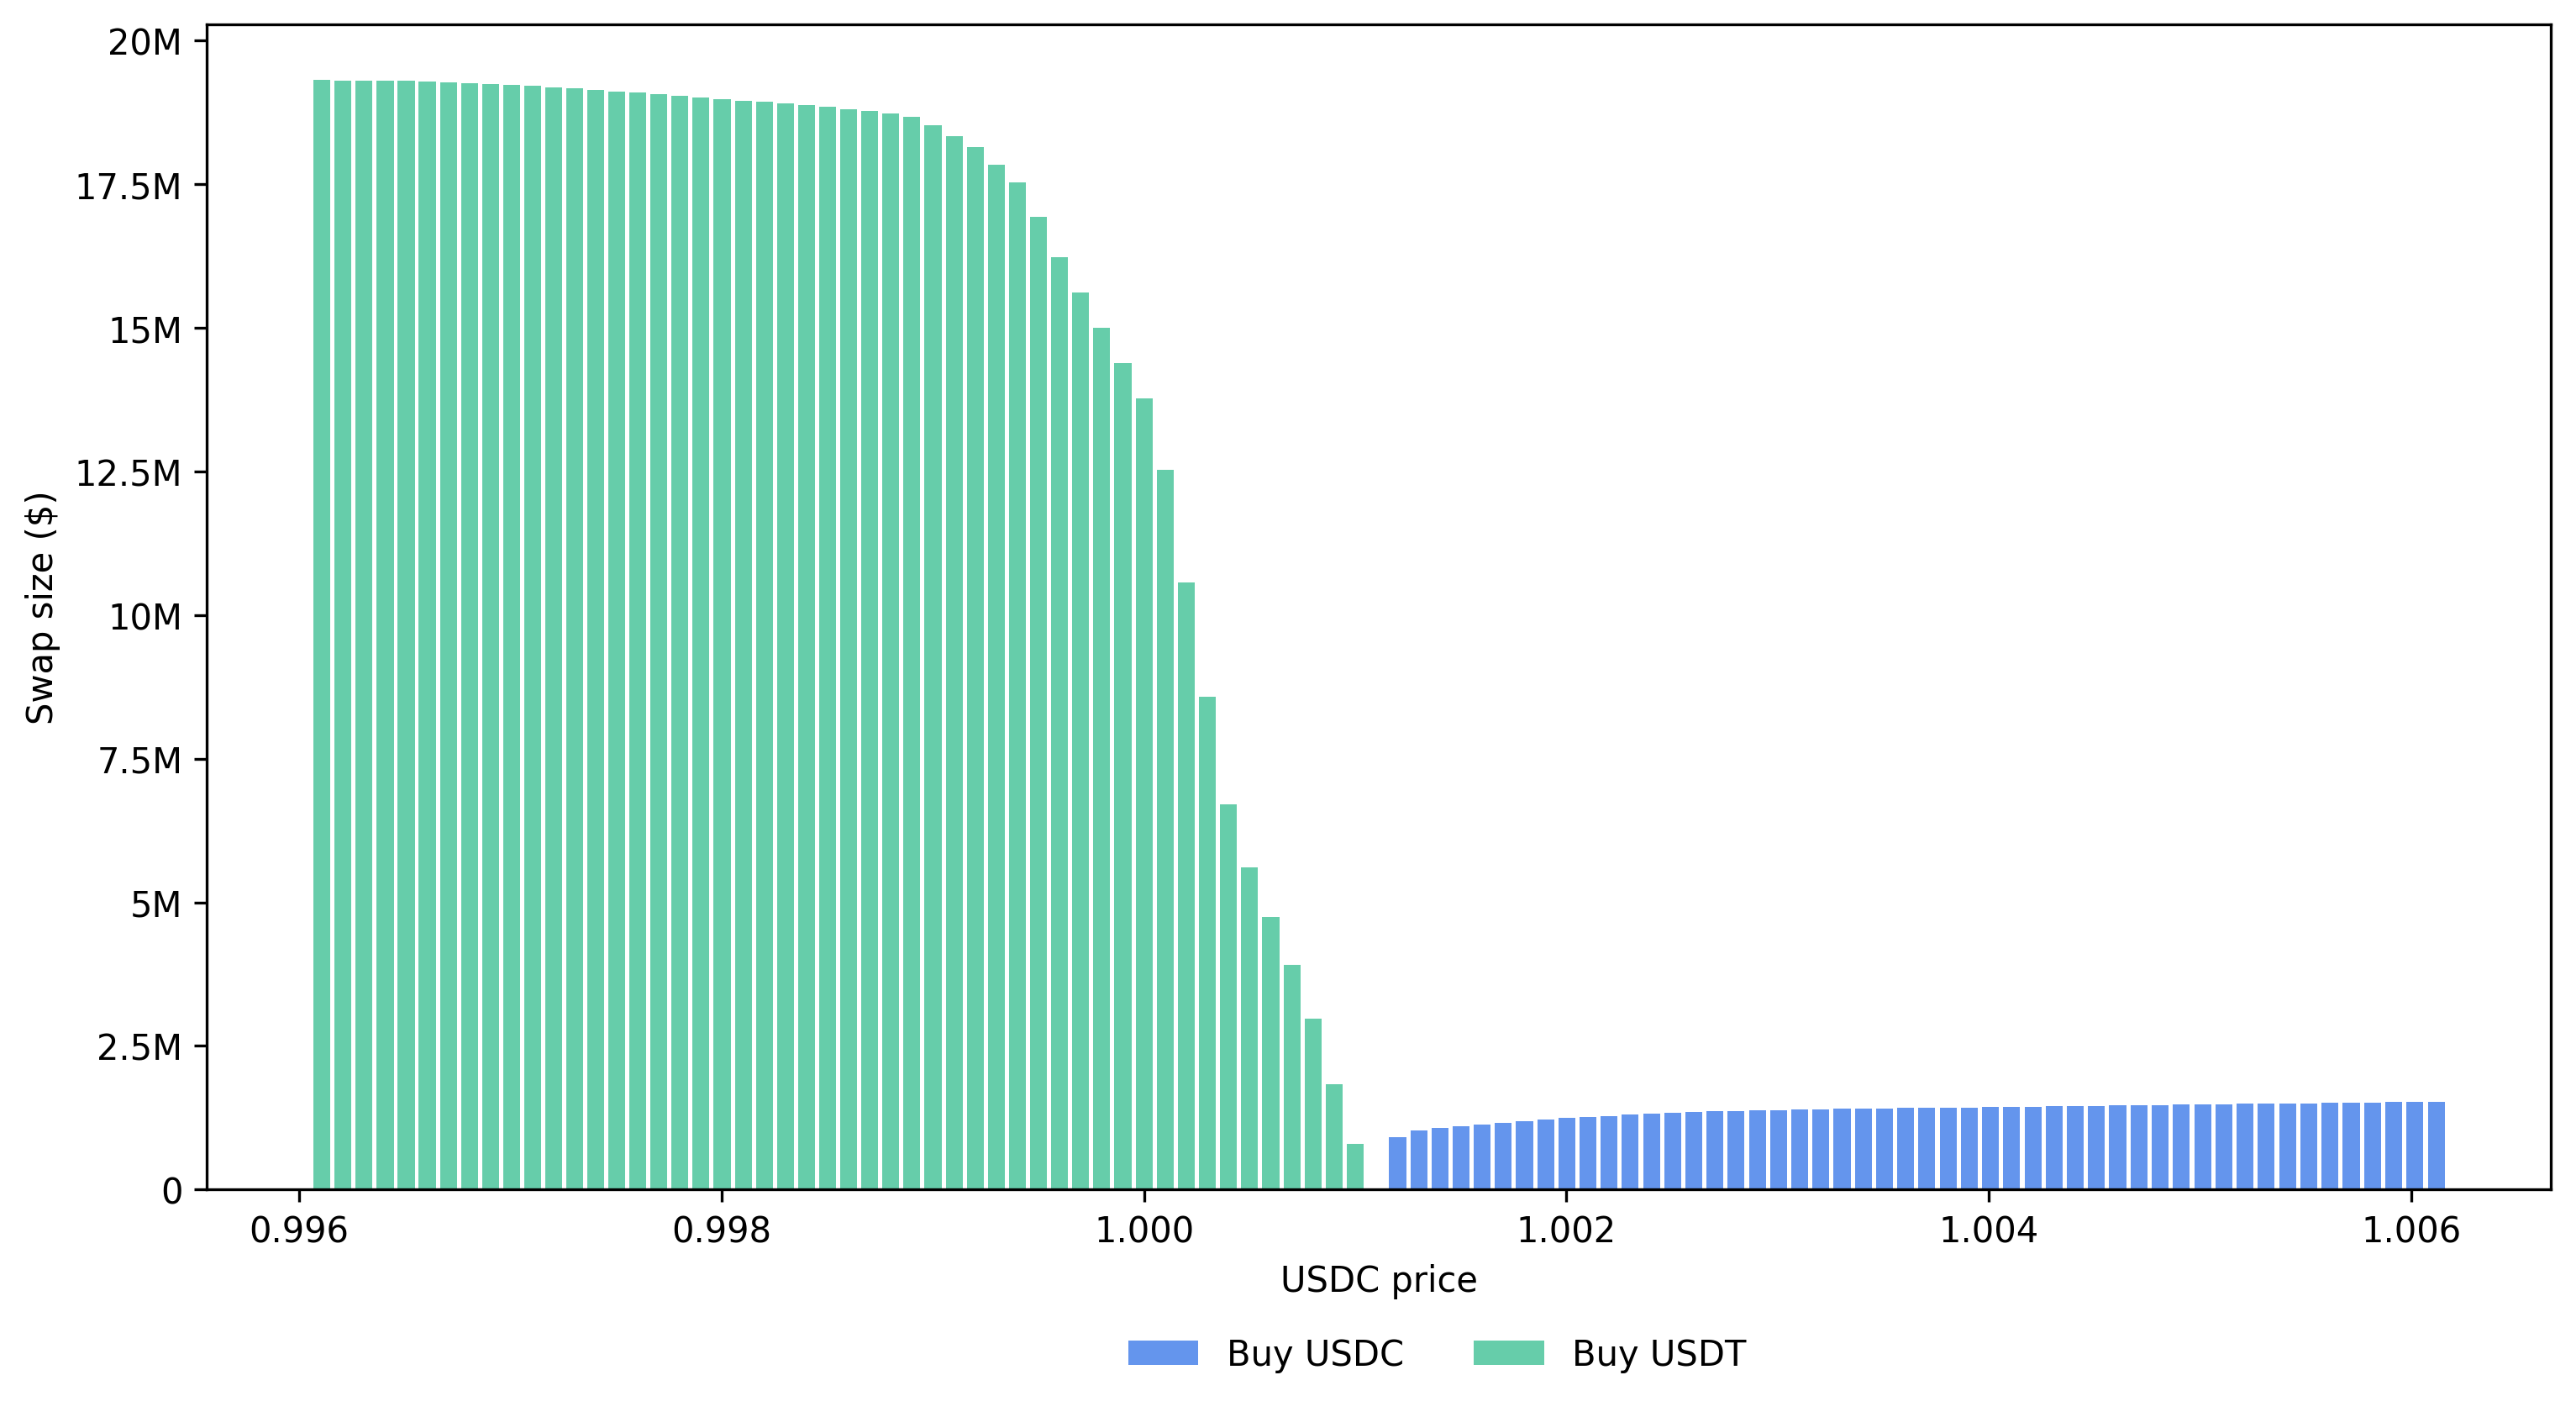
Run the notebook:
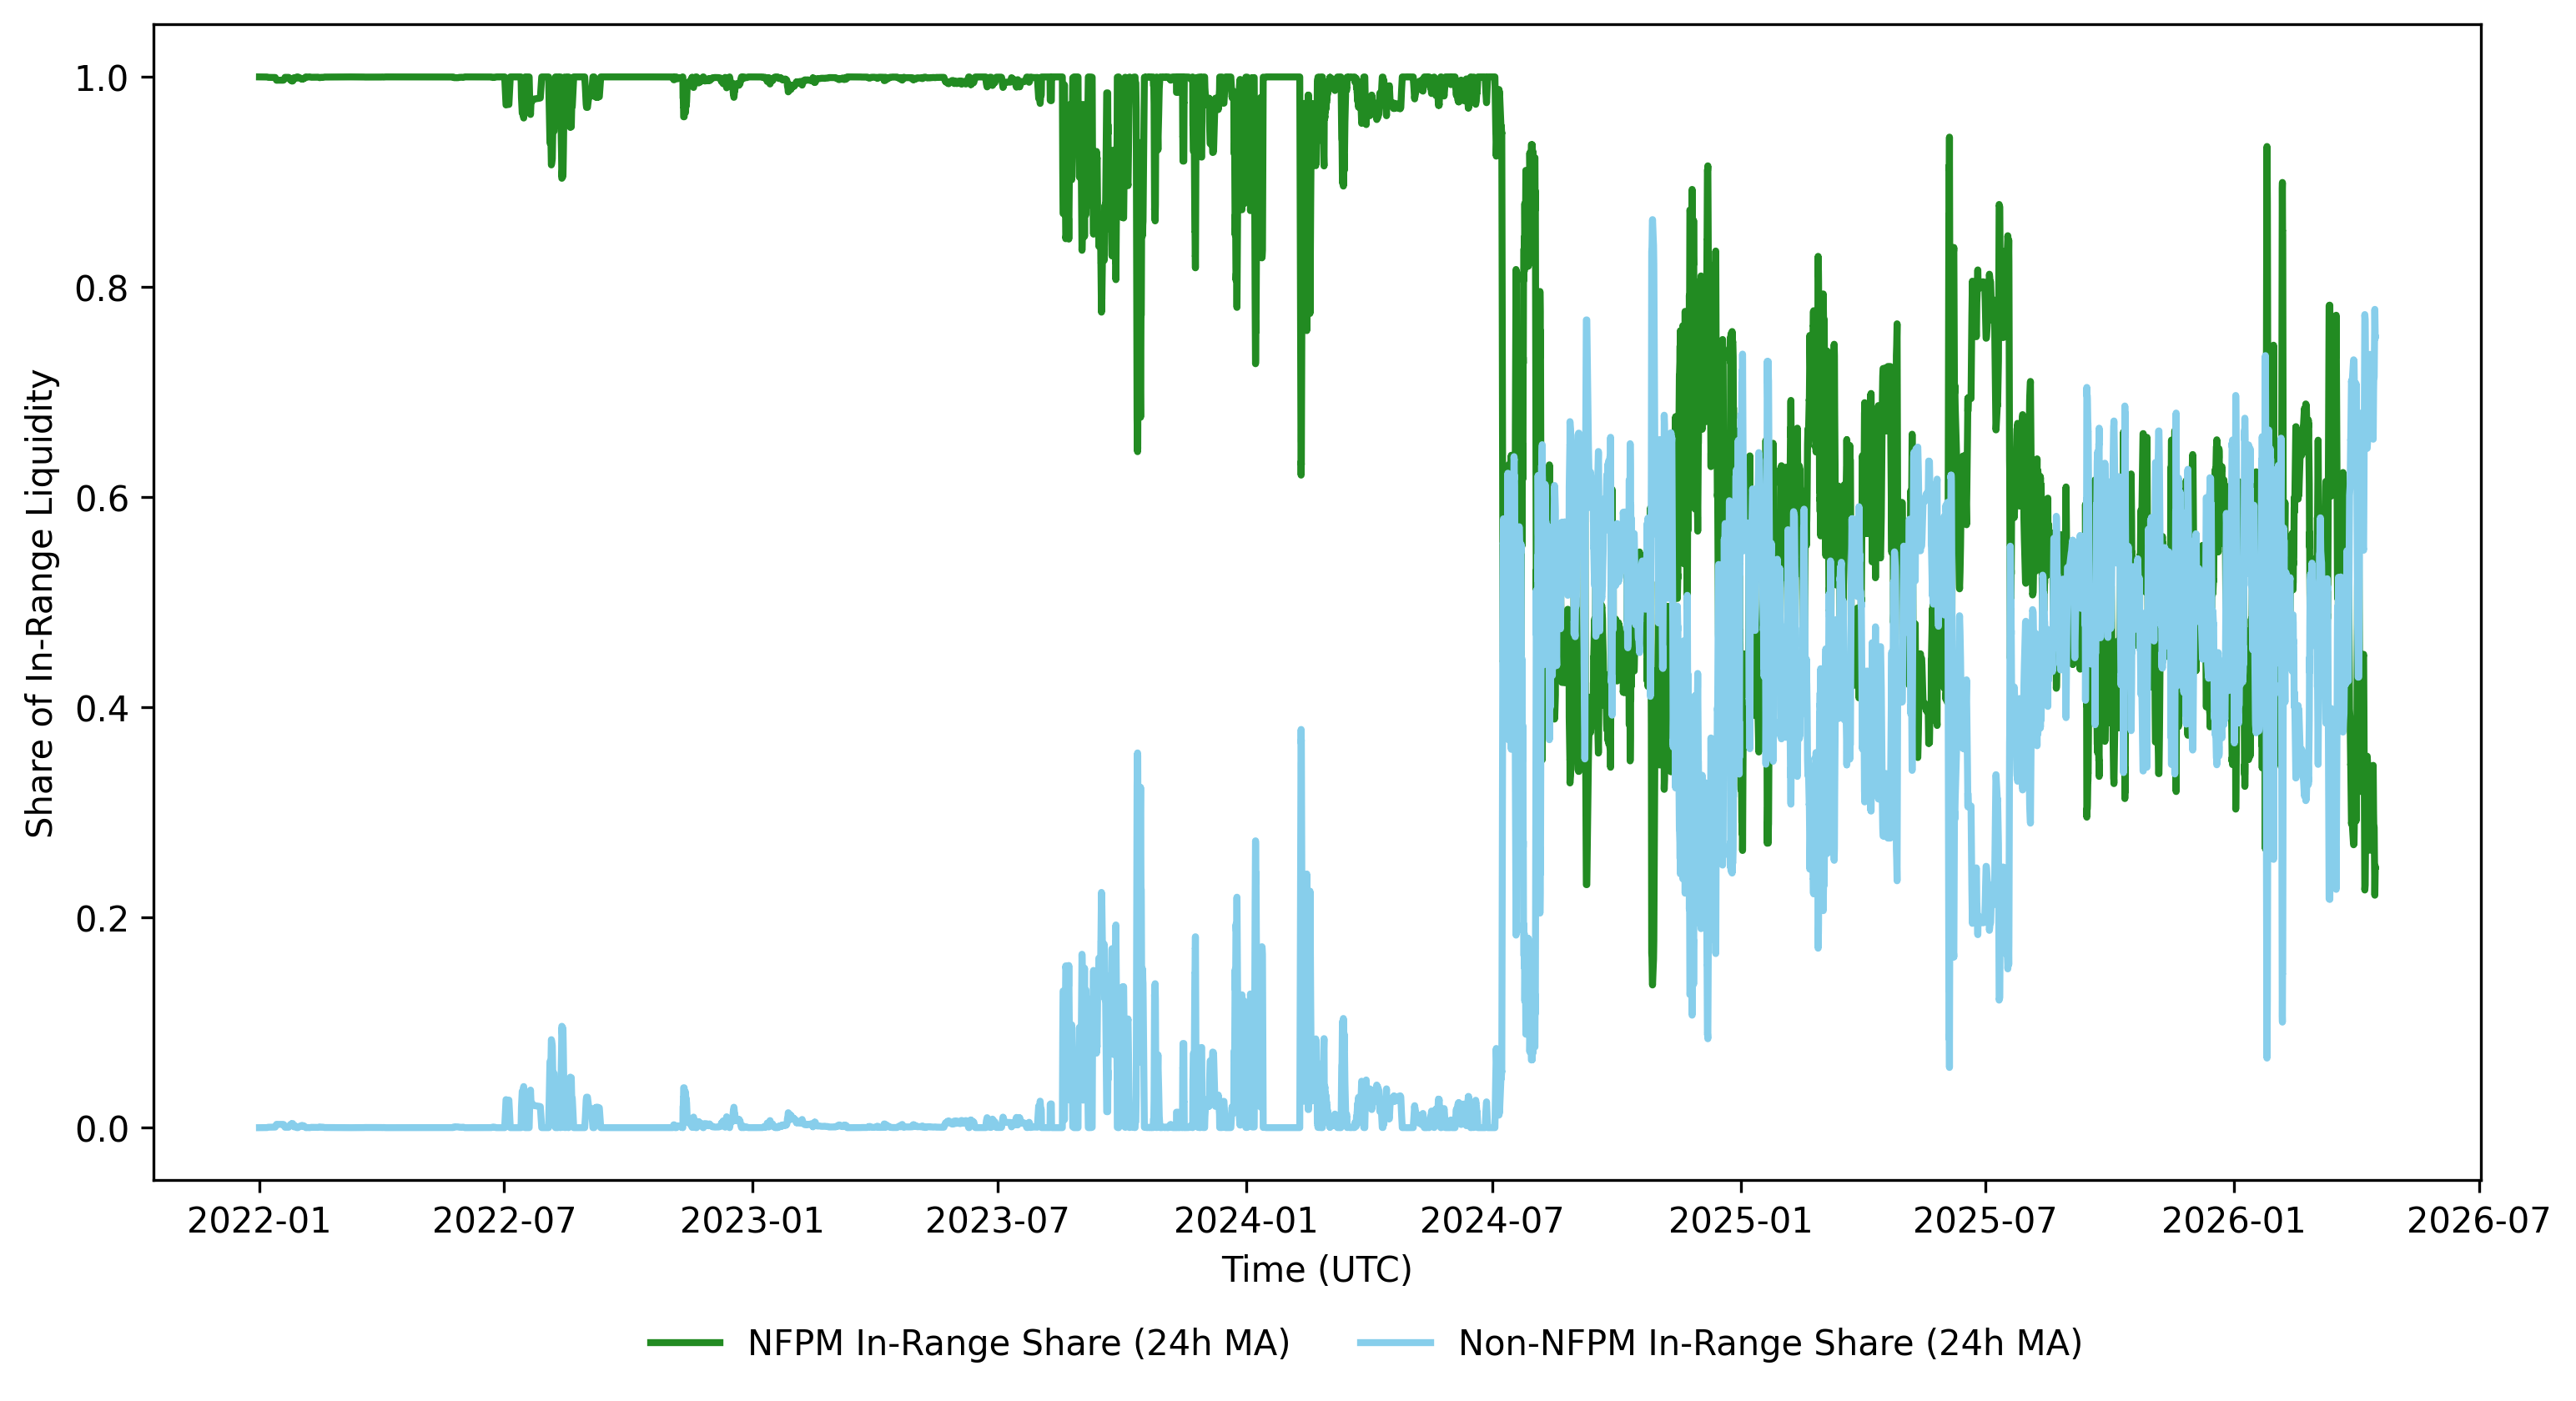
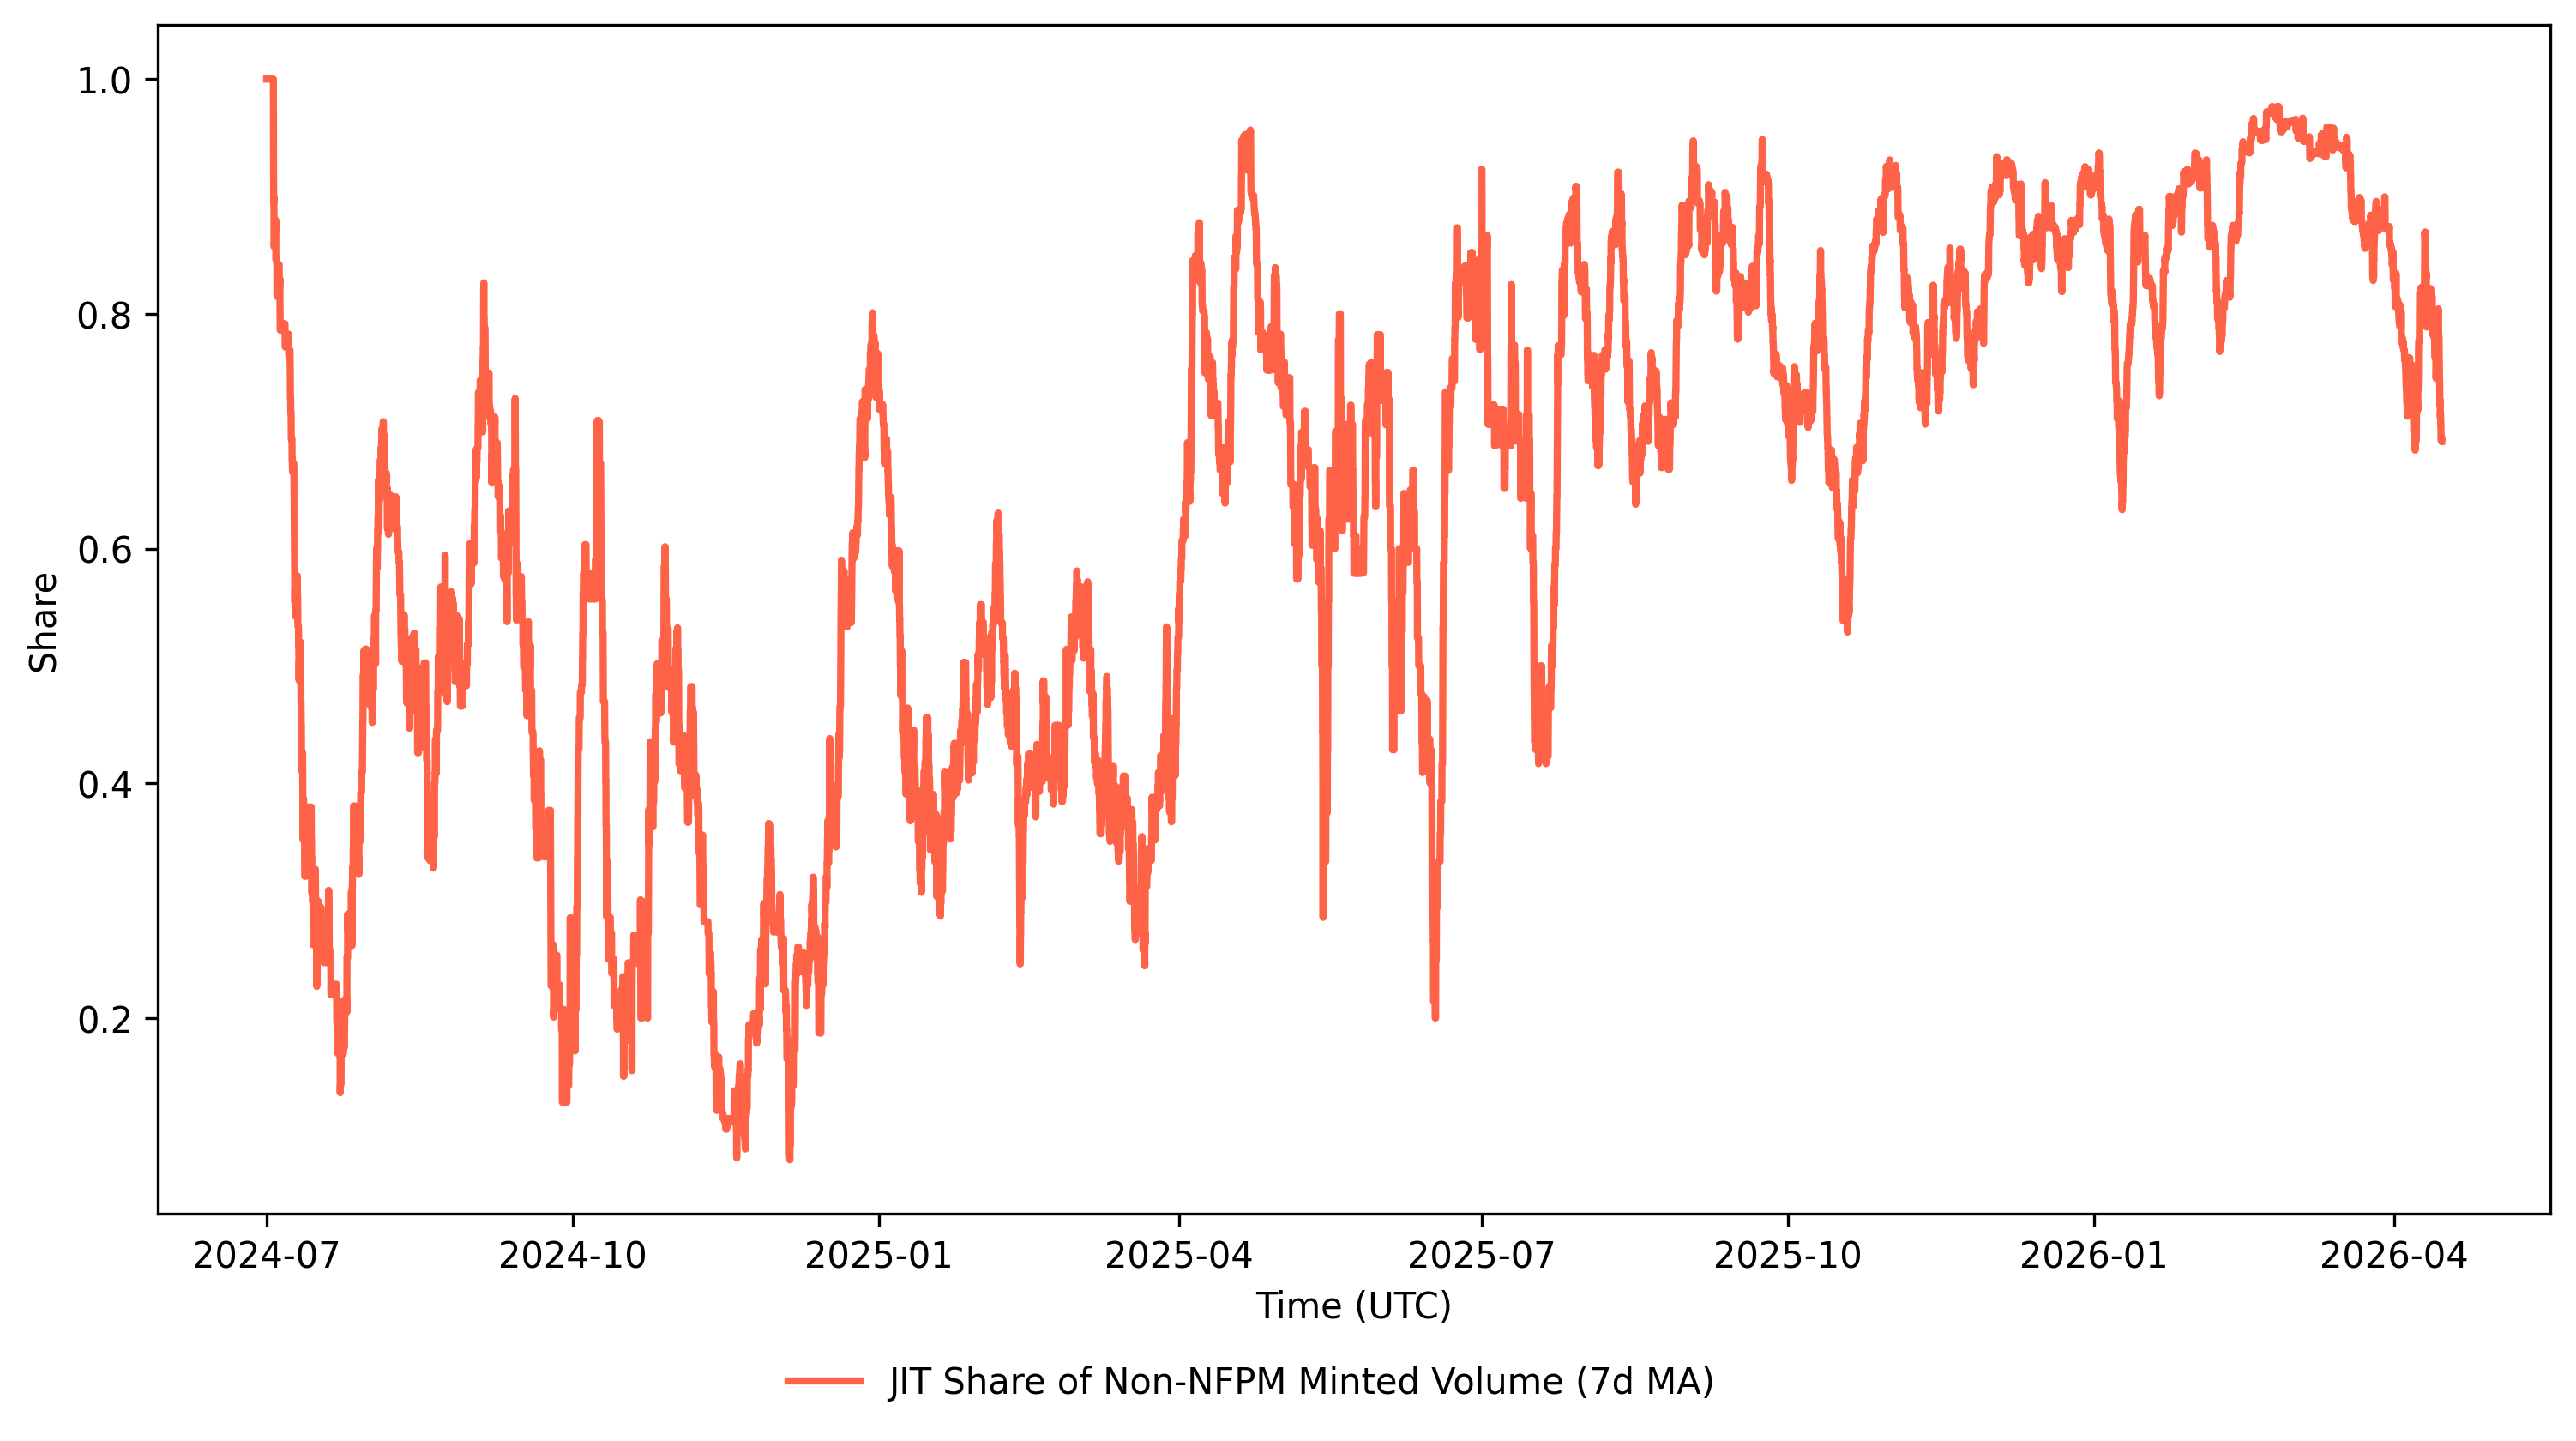
3.\ Uniswap\ liquidity\ curve/code.ipynbThis quantlet analyses ownership graphs of stablecoin liquidity on the 3pool and Uniswap. We first higlight the gap in TVL between the two venues, which is explained in part by Curve's liquidity being 70 owned by a hacker's cold wallet. We further highlight the distribution of whales on Curve's main stablecoin pool and the importance of metapools for the marketcap of the 3CRV LP token. Furthermore, we analyse the rise of MEV activity on the USDC-USDT v3 pool, showing a consistent volume of JIT (Just In Time) liquidity starting sometime in 2024. JIT liquidity is detected through block matching of mint and burn orders and we show it account for a major part of non-NFPM order flow.
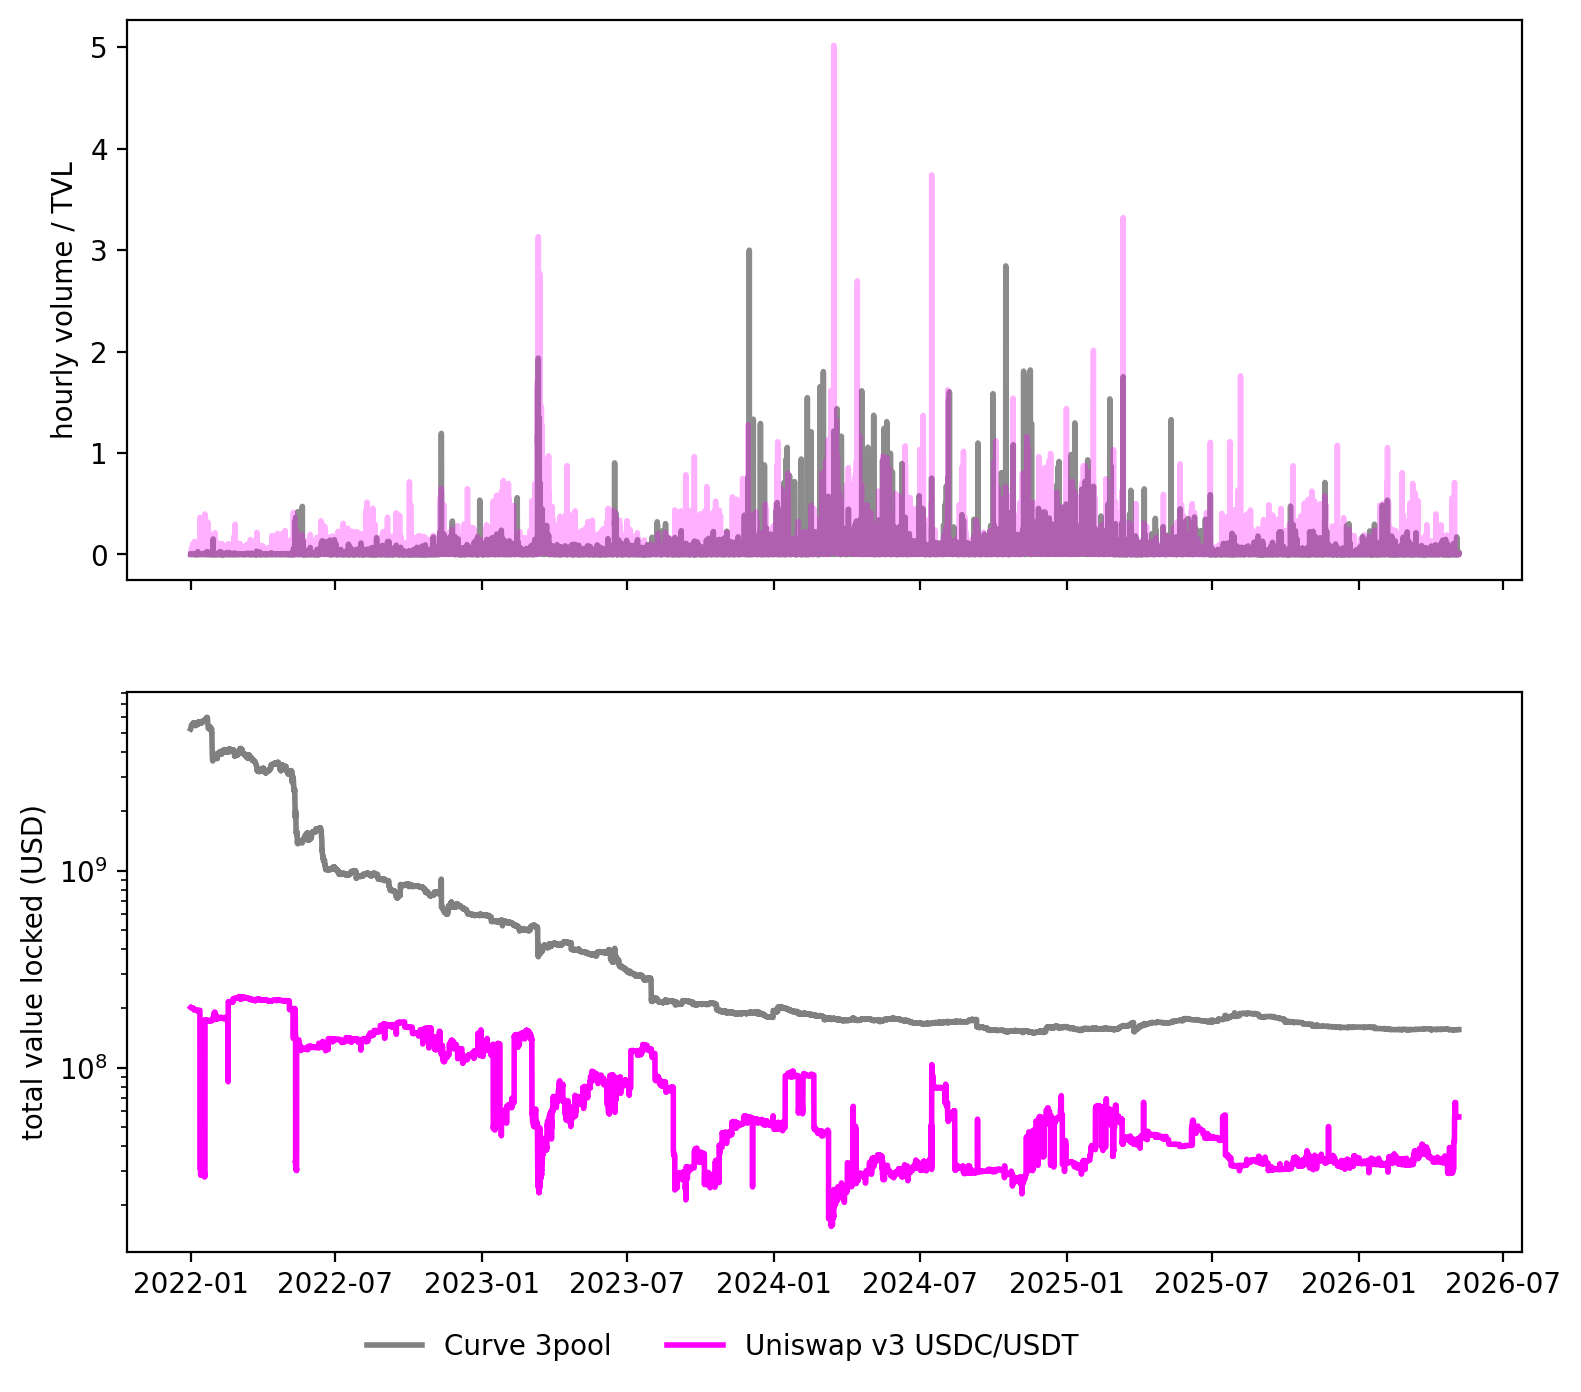
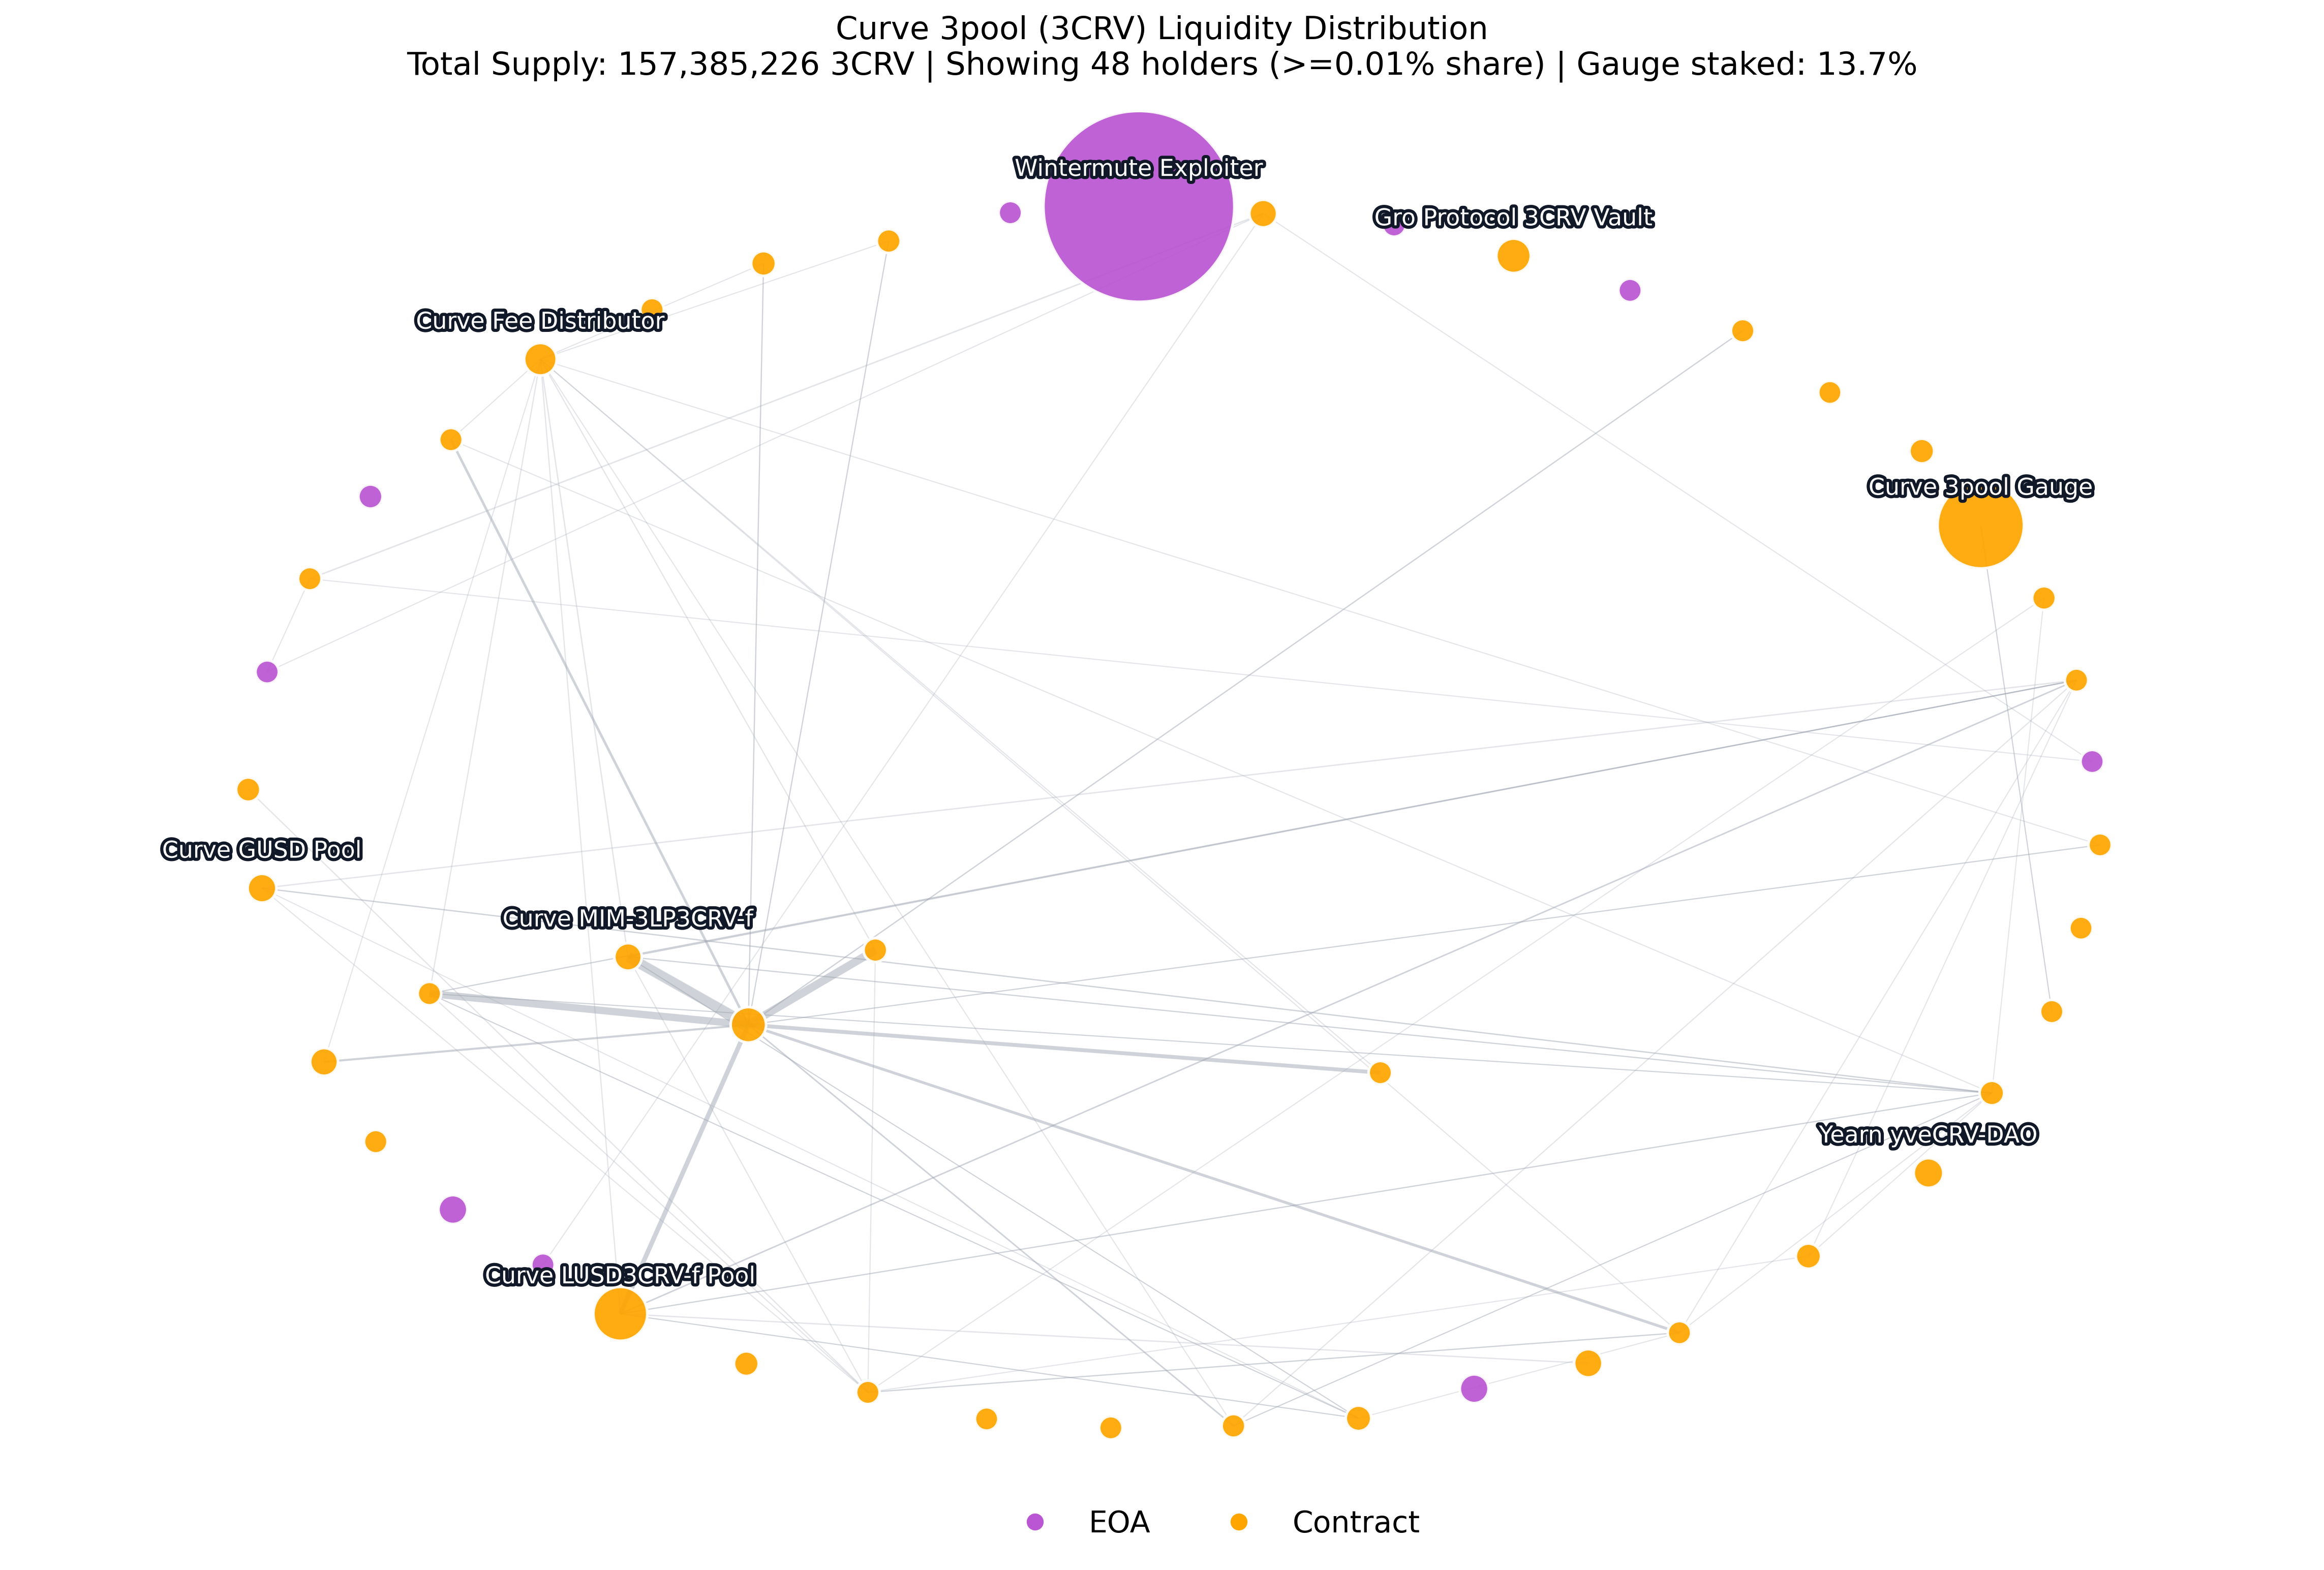
Run the notebook:
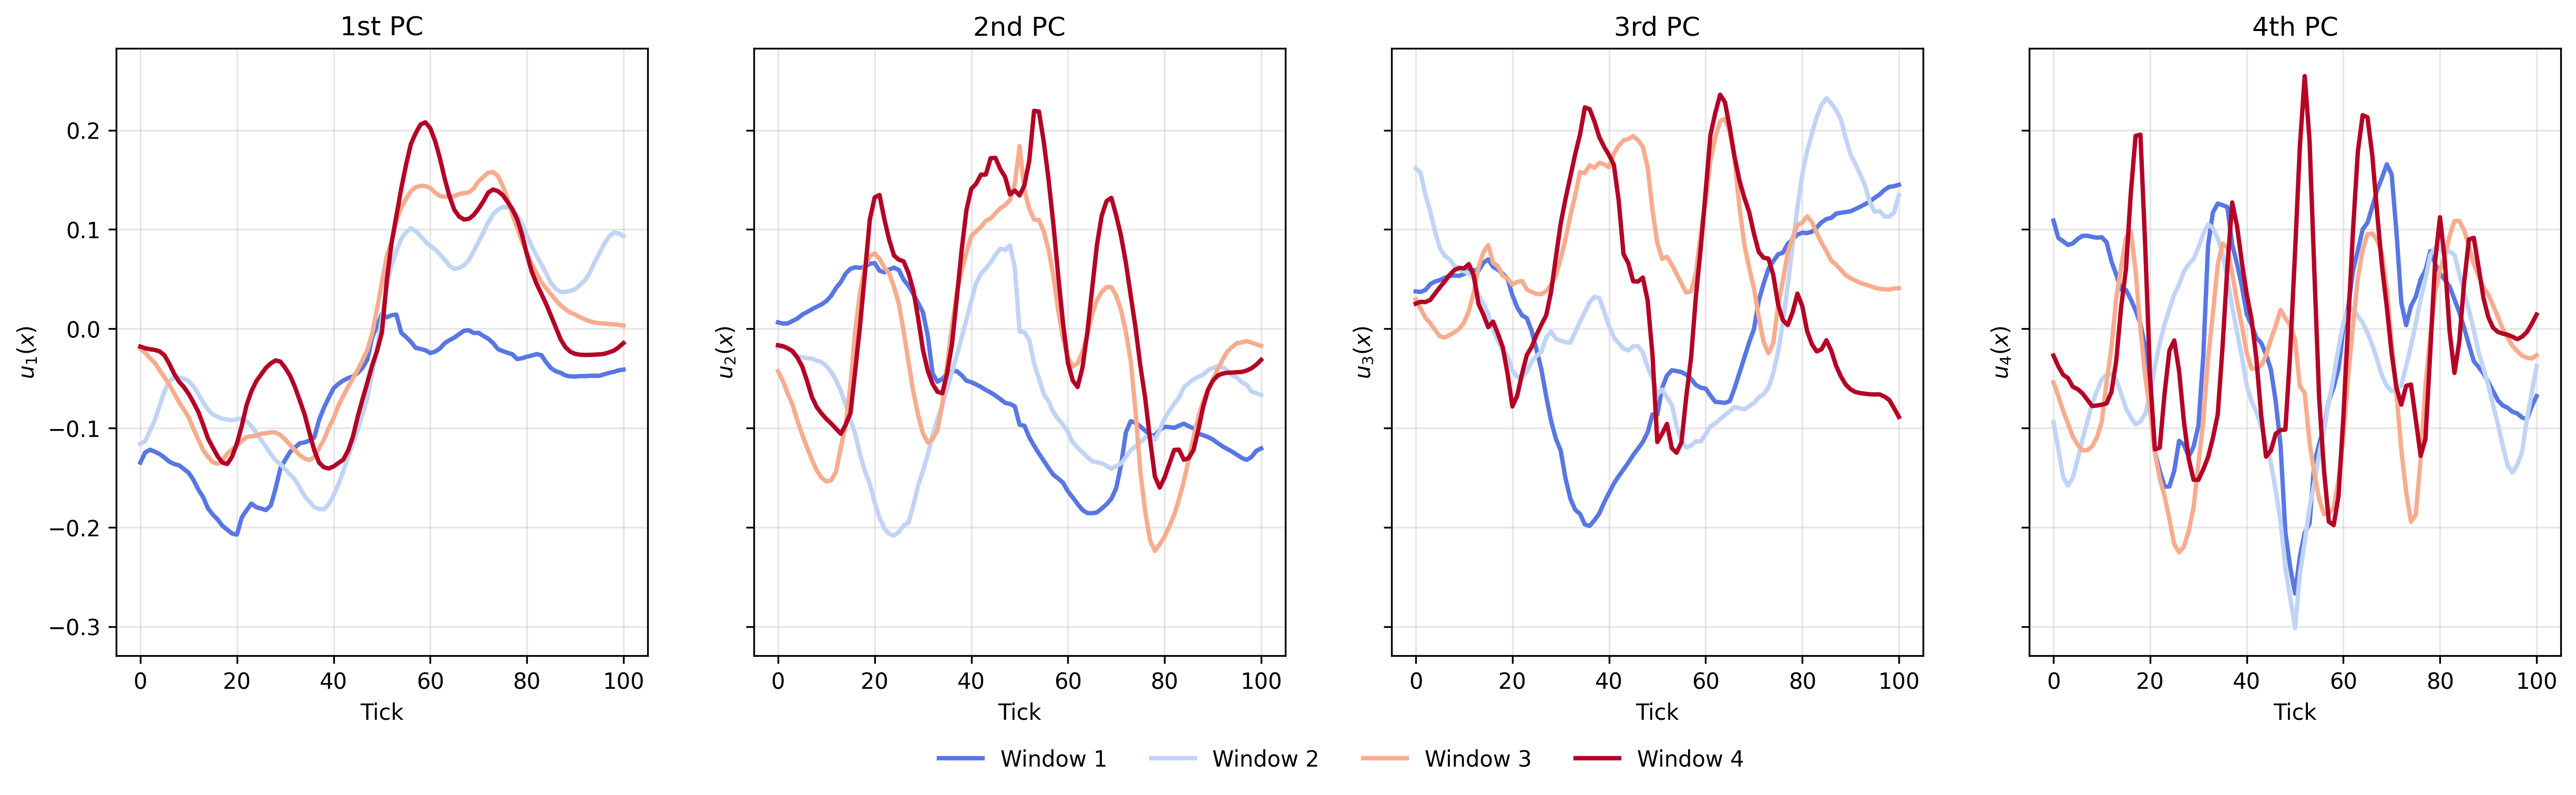
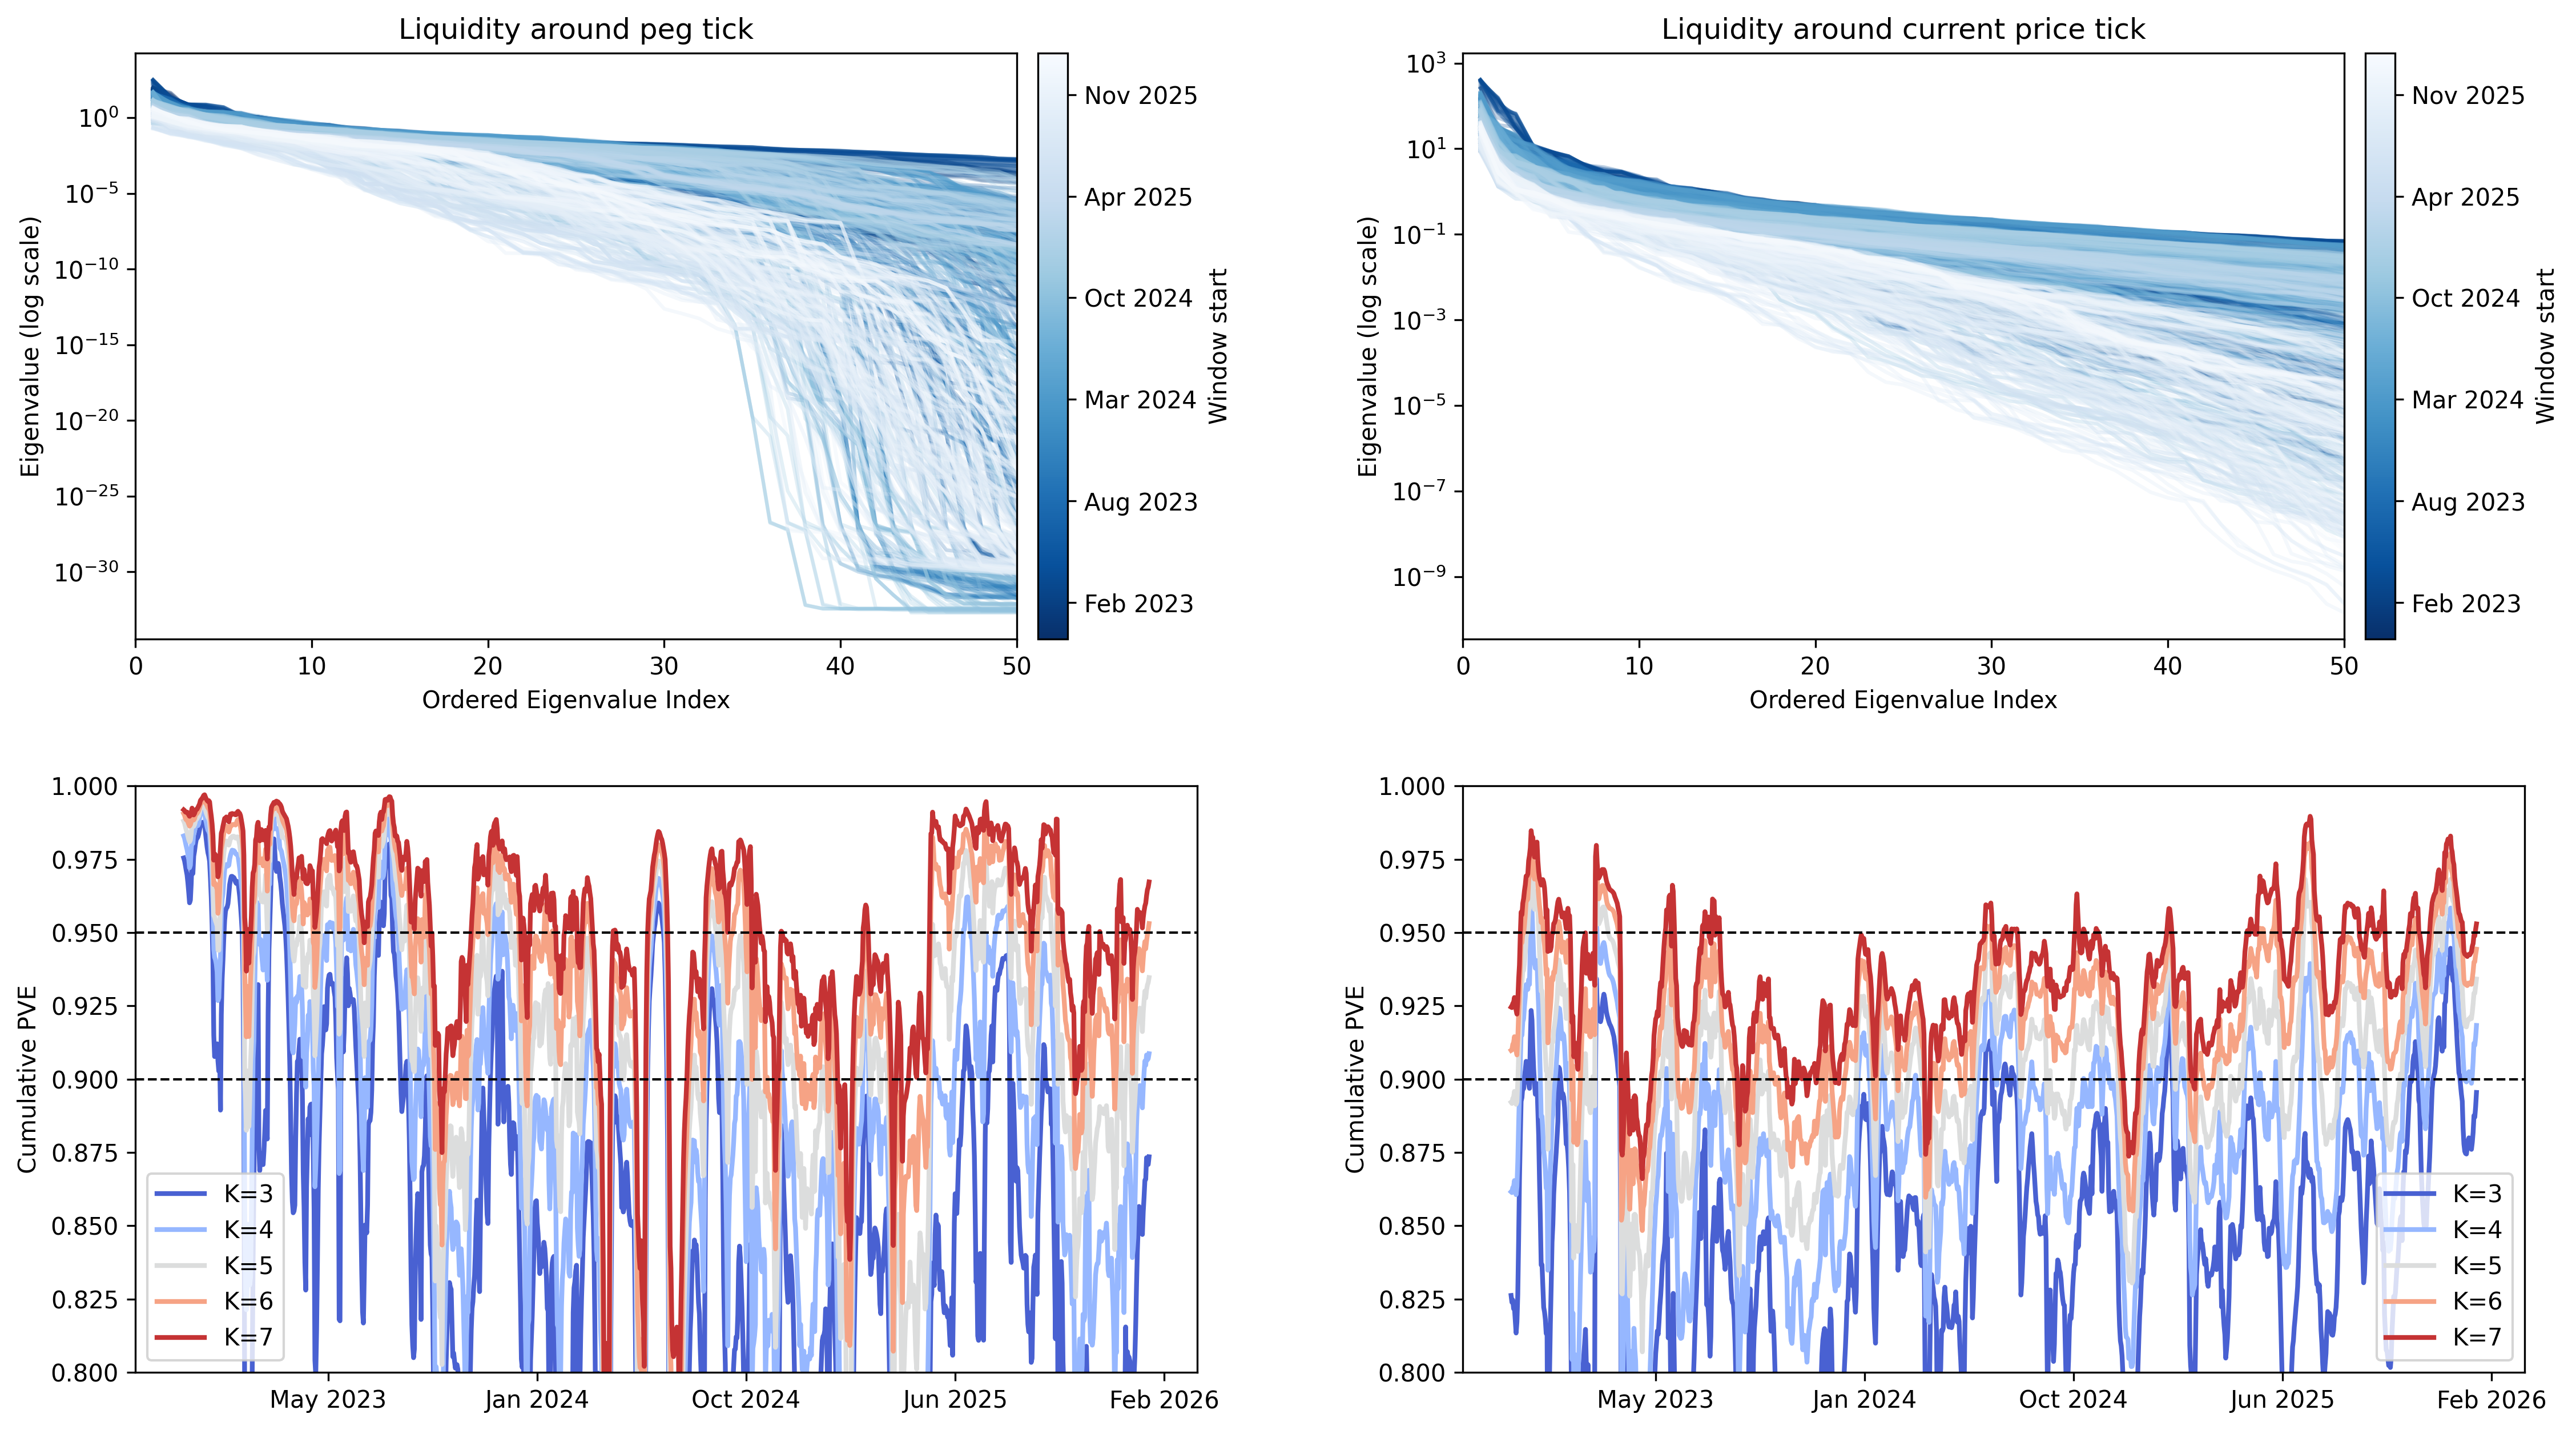
4.\ Stablecoin\ liquidity\ ownership/code.ipynbThis quantlet contains plots related to the functional PCA analysis of the log-liquidity curve. FPCA is applied in a rolling window manner to study stability of the PCs and reliability of the decomposition through time using cumulative partial variance explained.


Run the notebook:
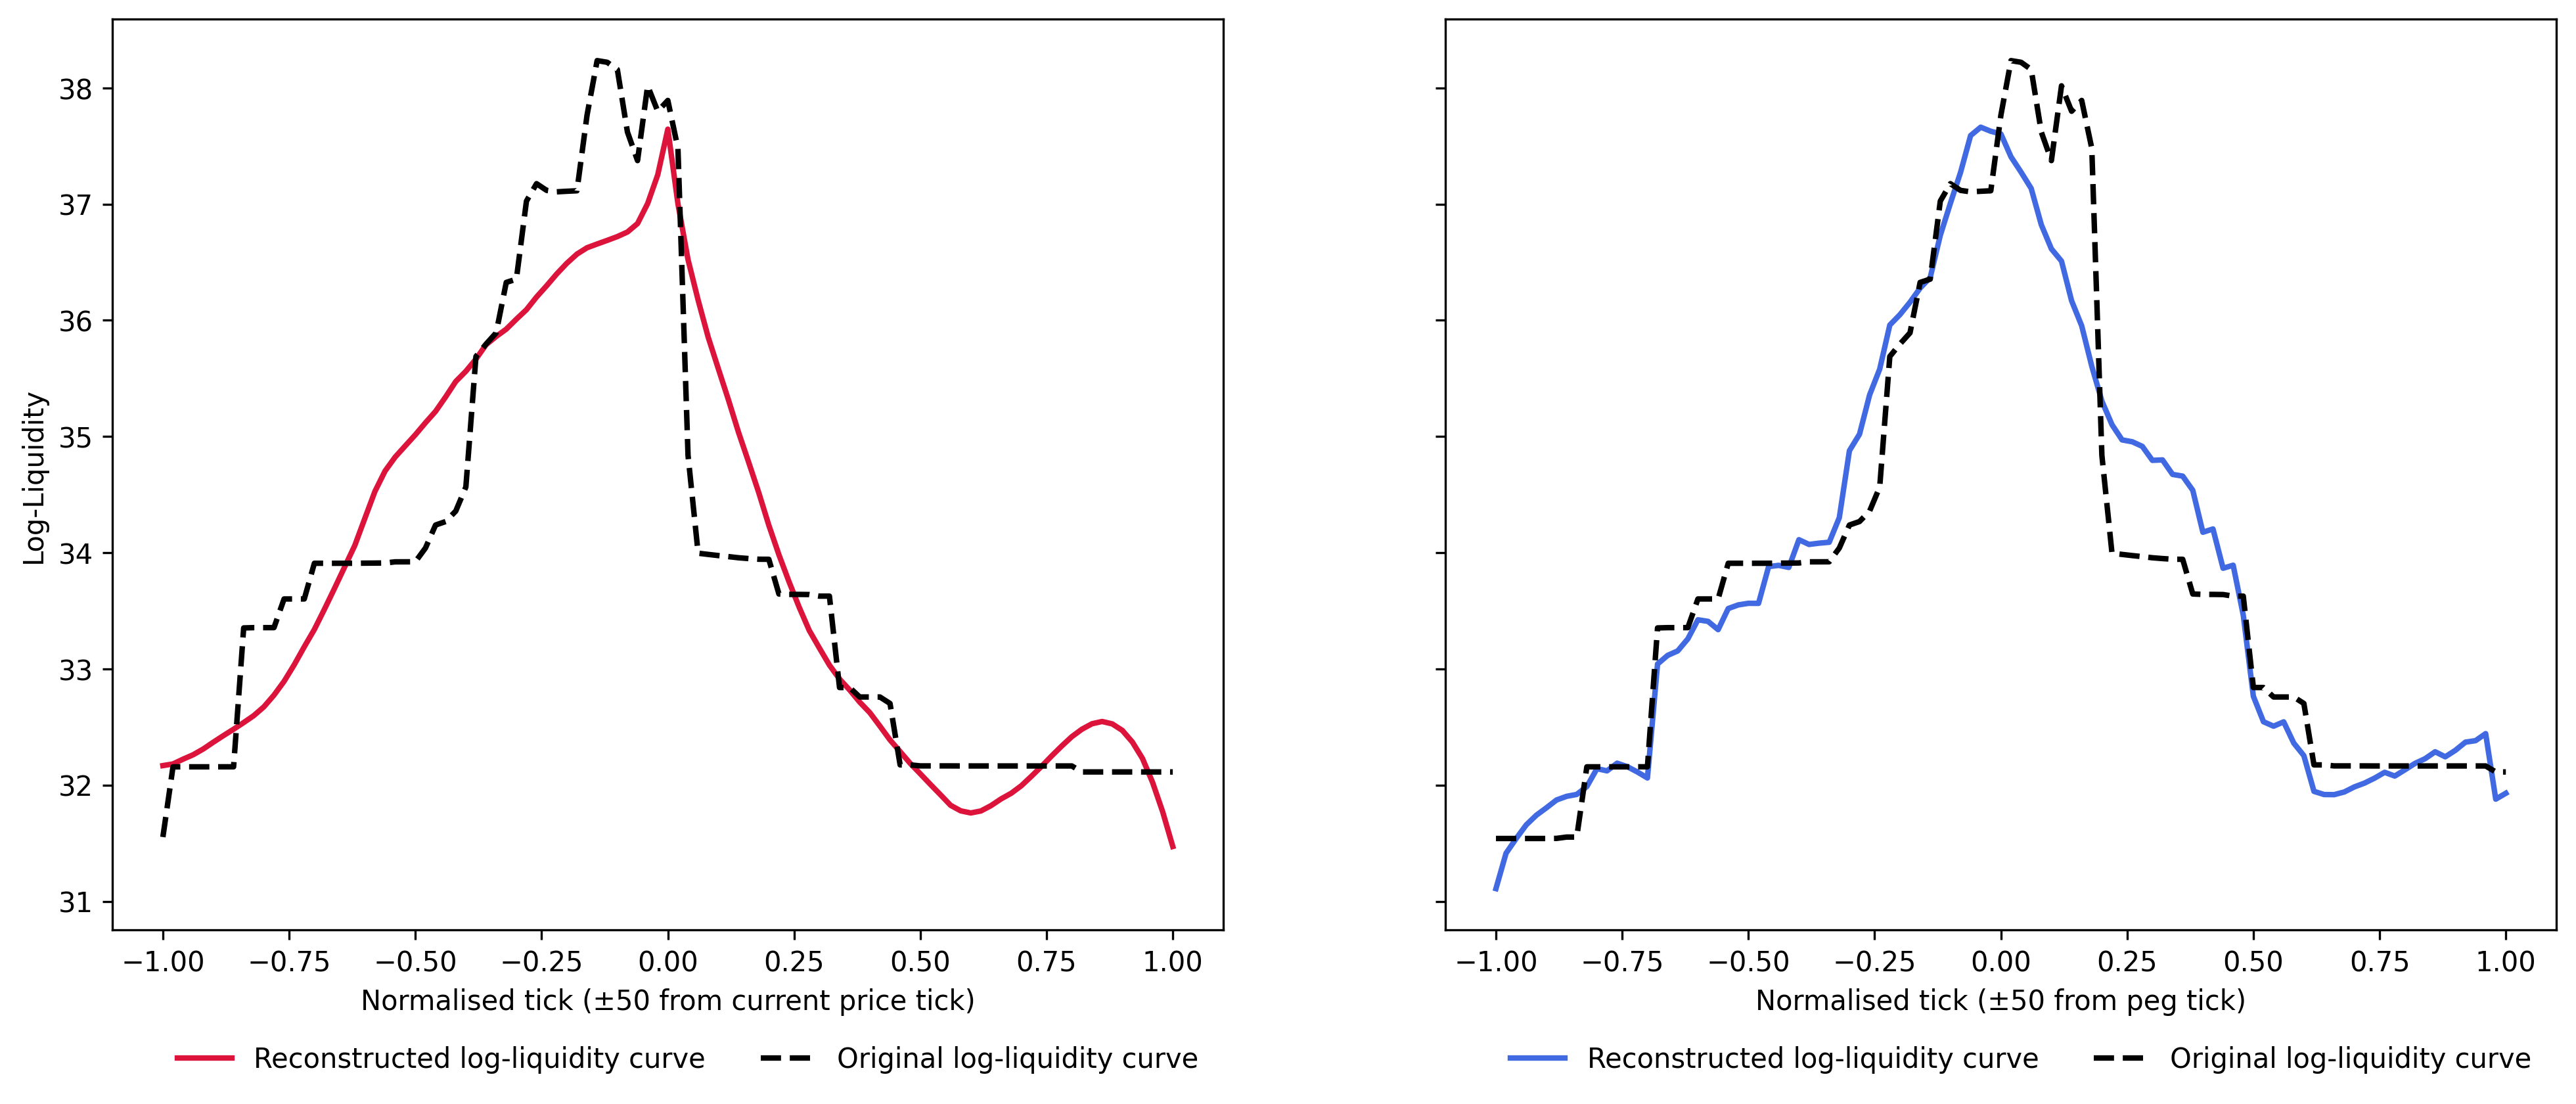
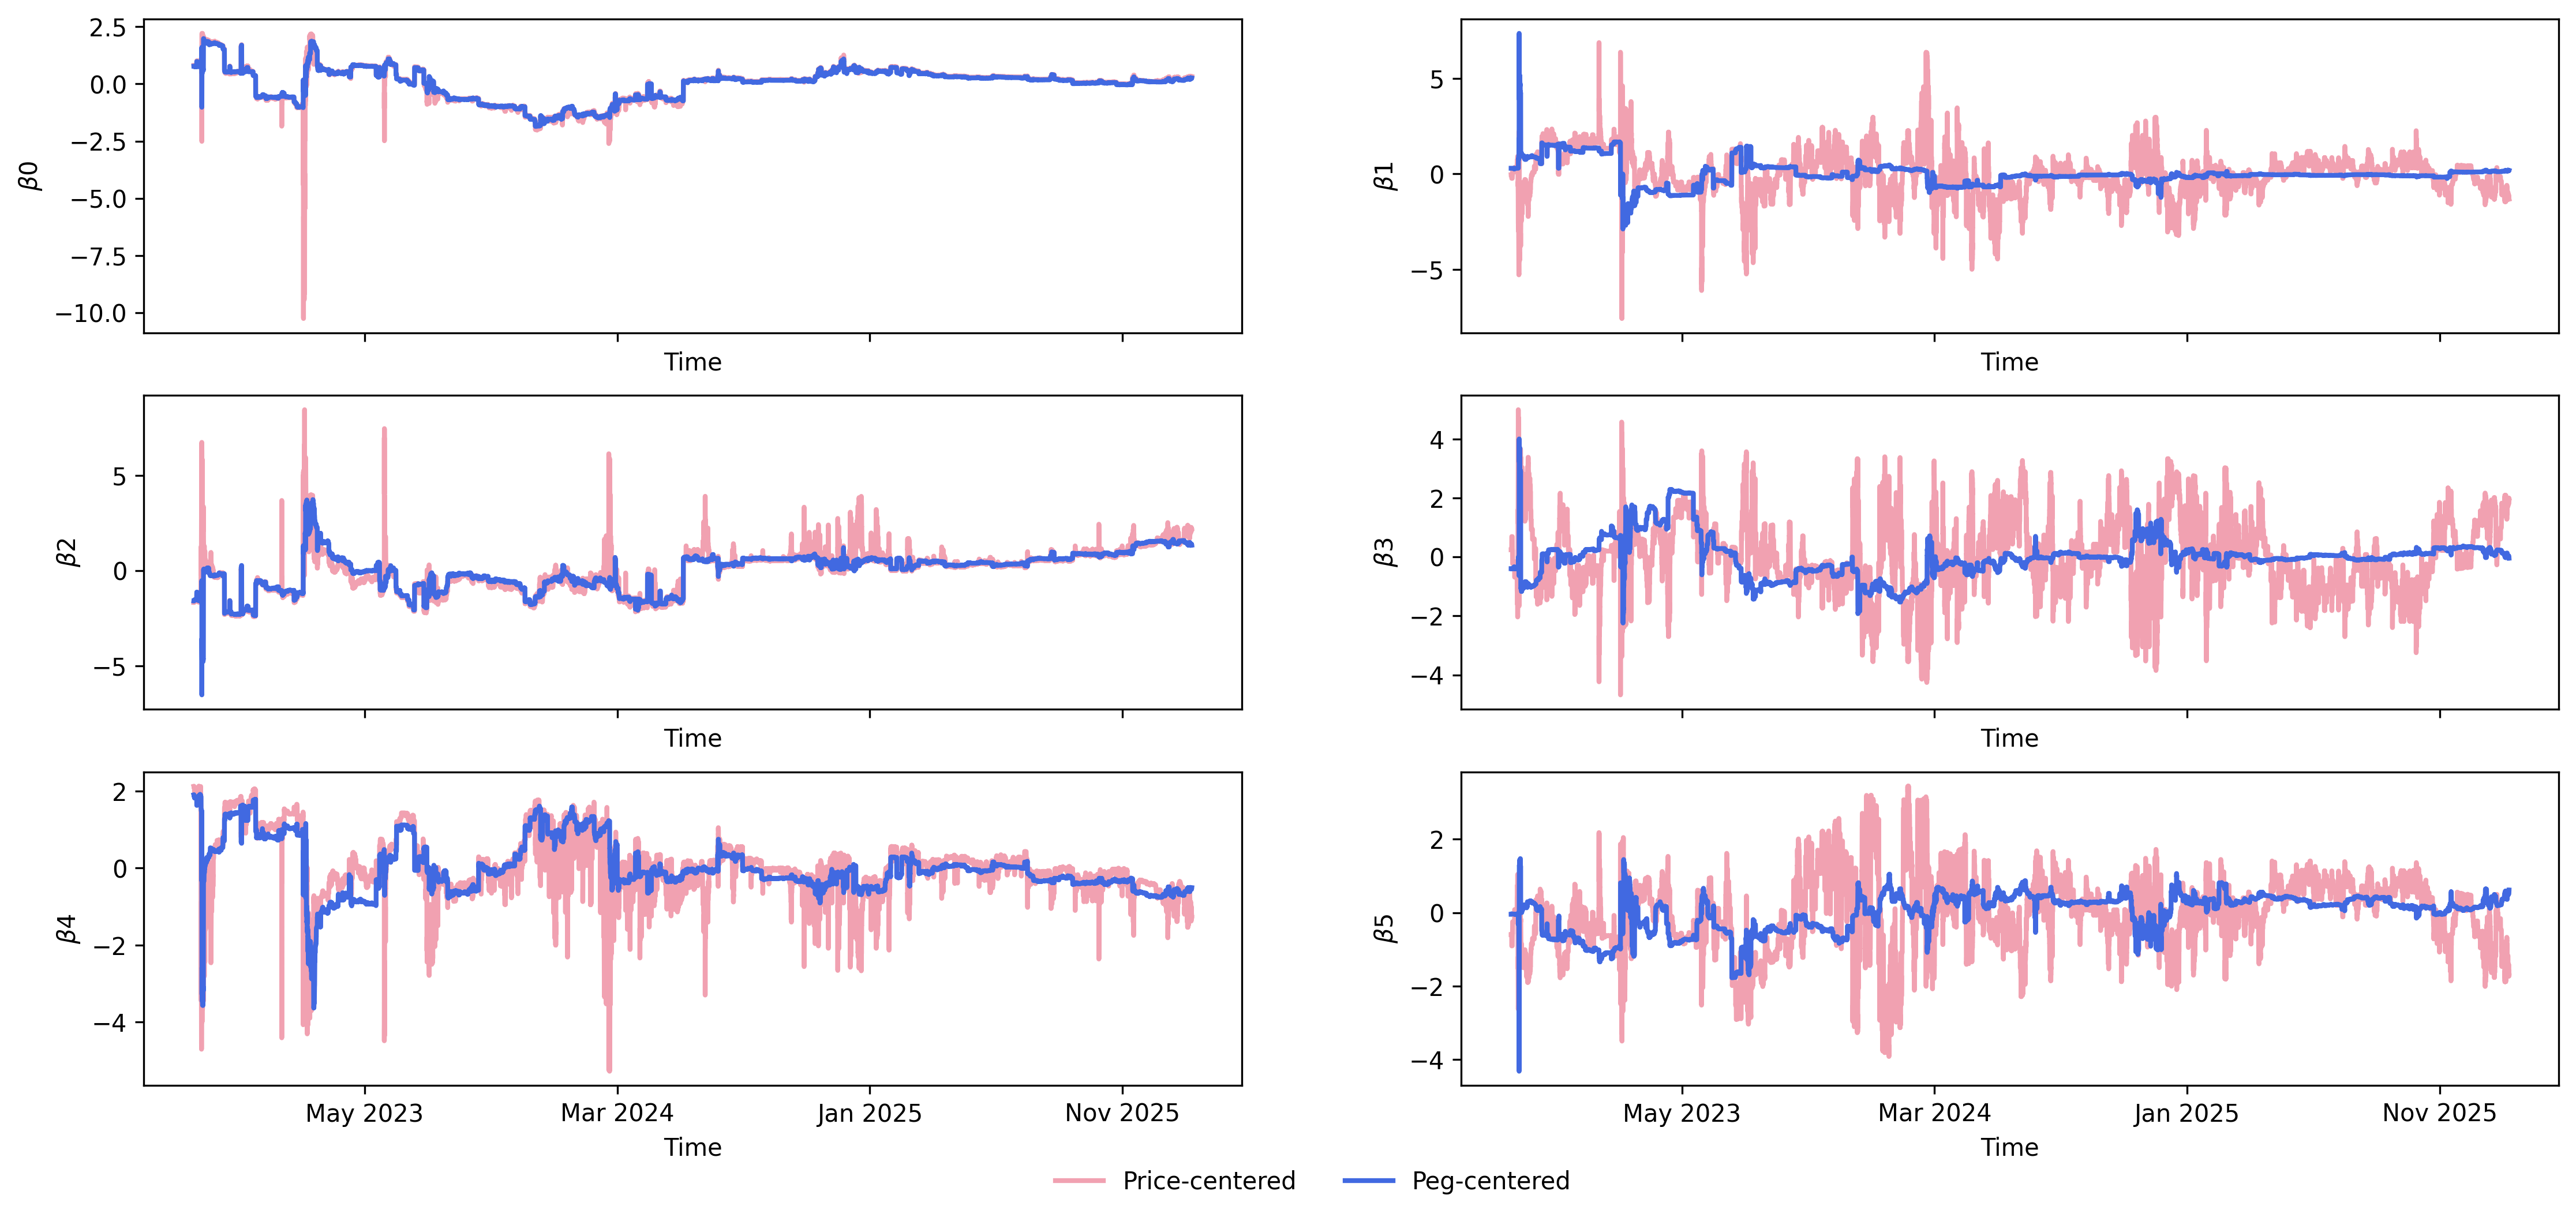
5. Functional PCA analysis of the liquidity curve/code.ipynbThis quantlet creates plots evaluating the decomposition of the log-Liquidity curve into an interpretable Legendre polynomial basis. We specifically compare the interpretability of a peg and price centered decomposition. Showing that while a price centered decomposition might look more stable it is unfit for stablecoin study due to the static mass of liquidity at and around peg.
Run the notebook:
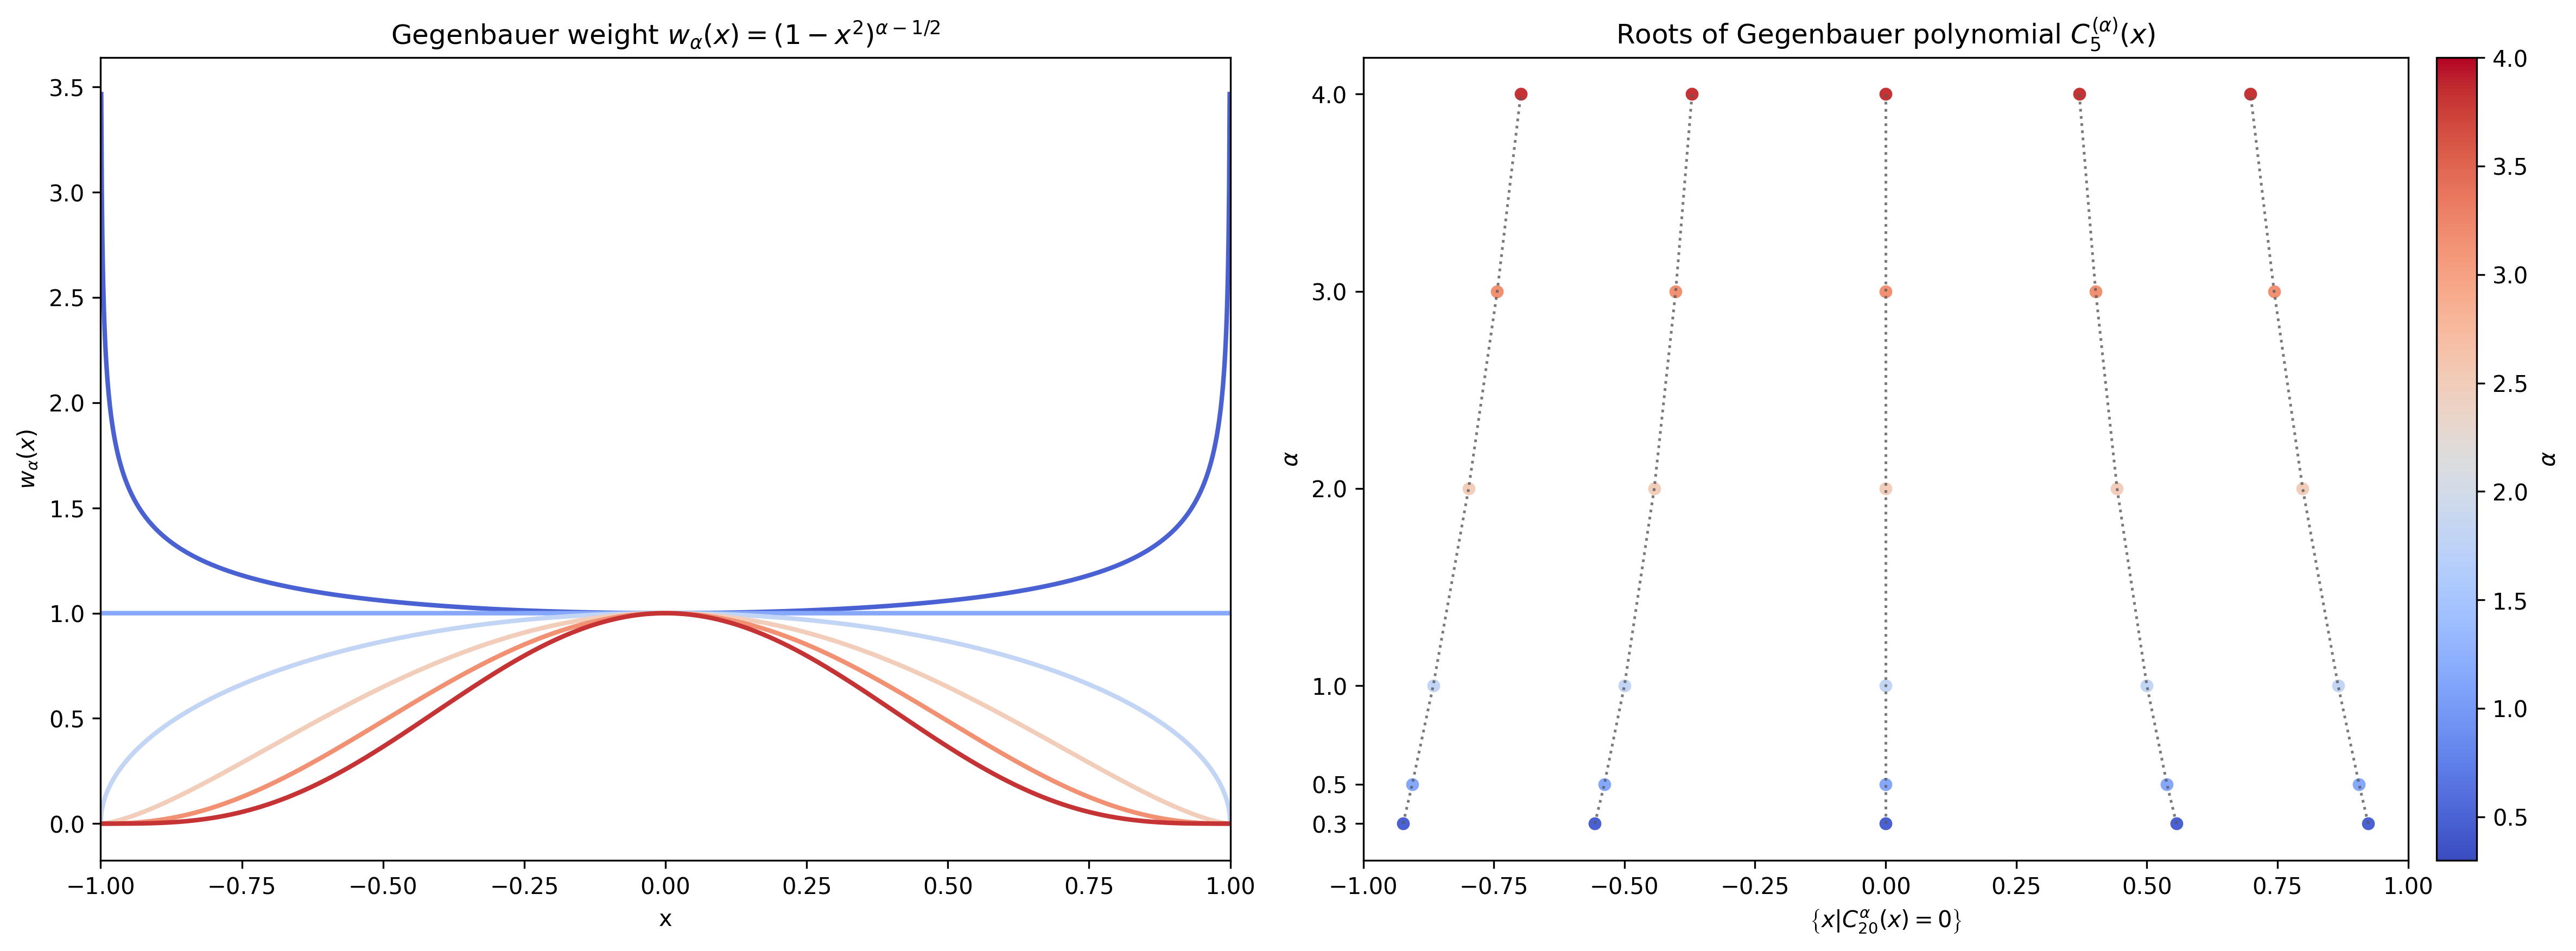
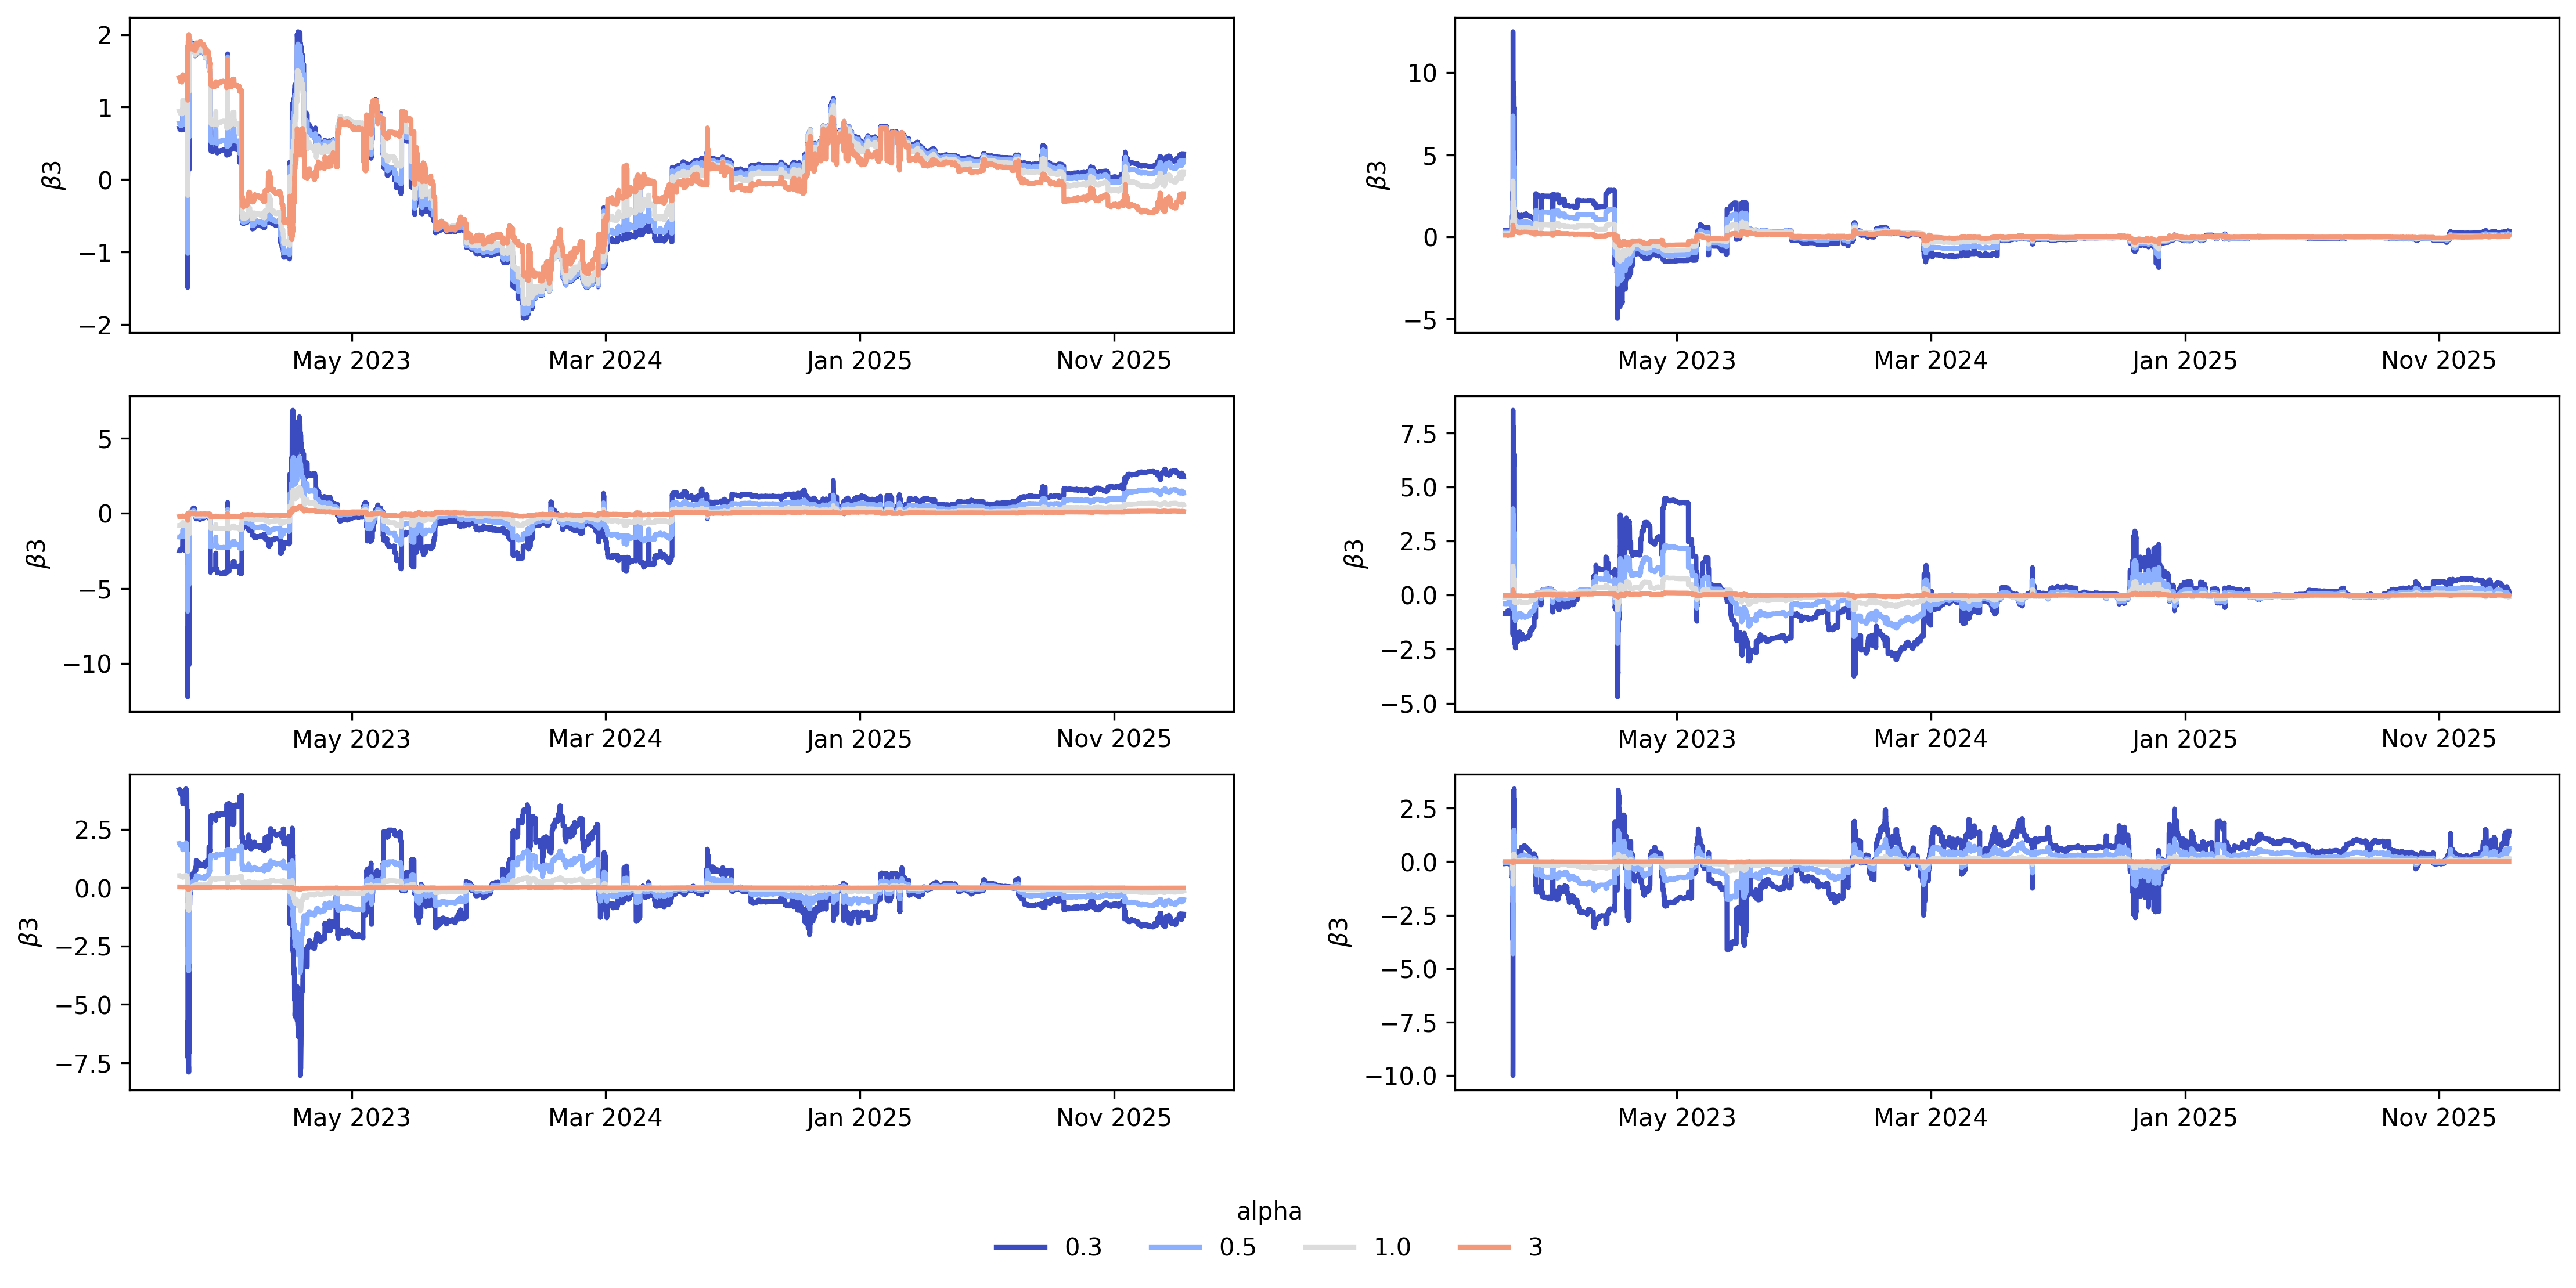
6. Legendre basis decomposition/code.ipynbThis quantlet documents the extension of the Legendre decomposition into more general Gegenbauer polynomial bases. The effect of the
Run the notebook:
7. Gegenbauer Polynomials/code.ipynbThis quantlet provides code to run full cross-validation analysis of common tree-based architectures on the previously built dataset of stablecoin liquidity data. The binary task is that of predicting a depeg deviation above 15 bps in the next 24 hours. The scripts allow Cross-validation for model selection and final retraining including a full suite of diagnostics for the final model's performance and explanations through internal feature impartance and SHAP explanations.
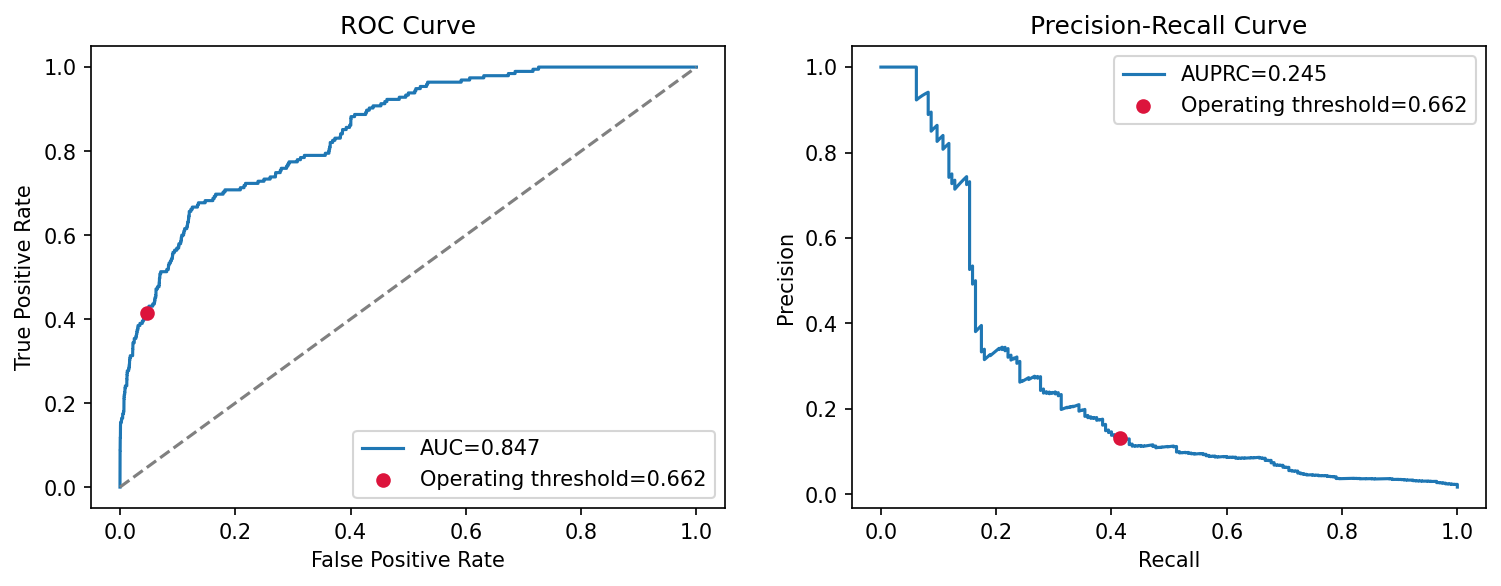
Final retraining AUC/AUPRC
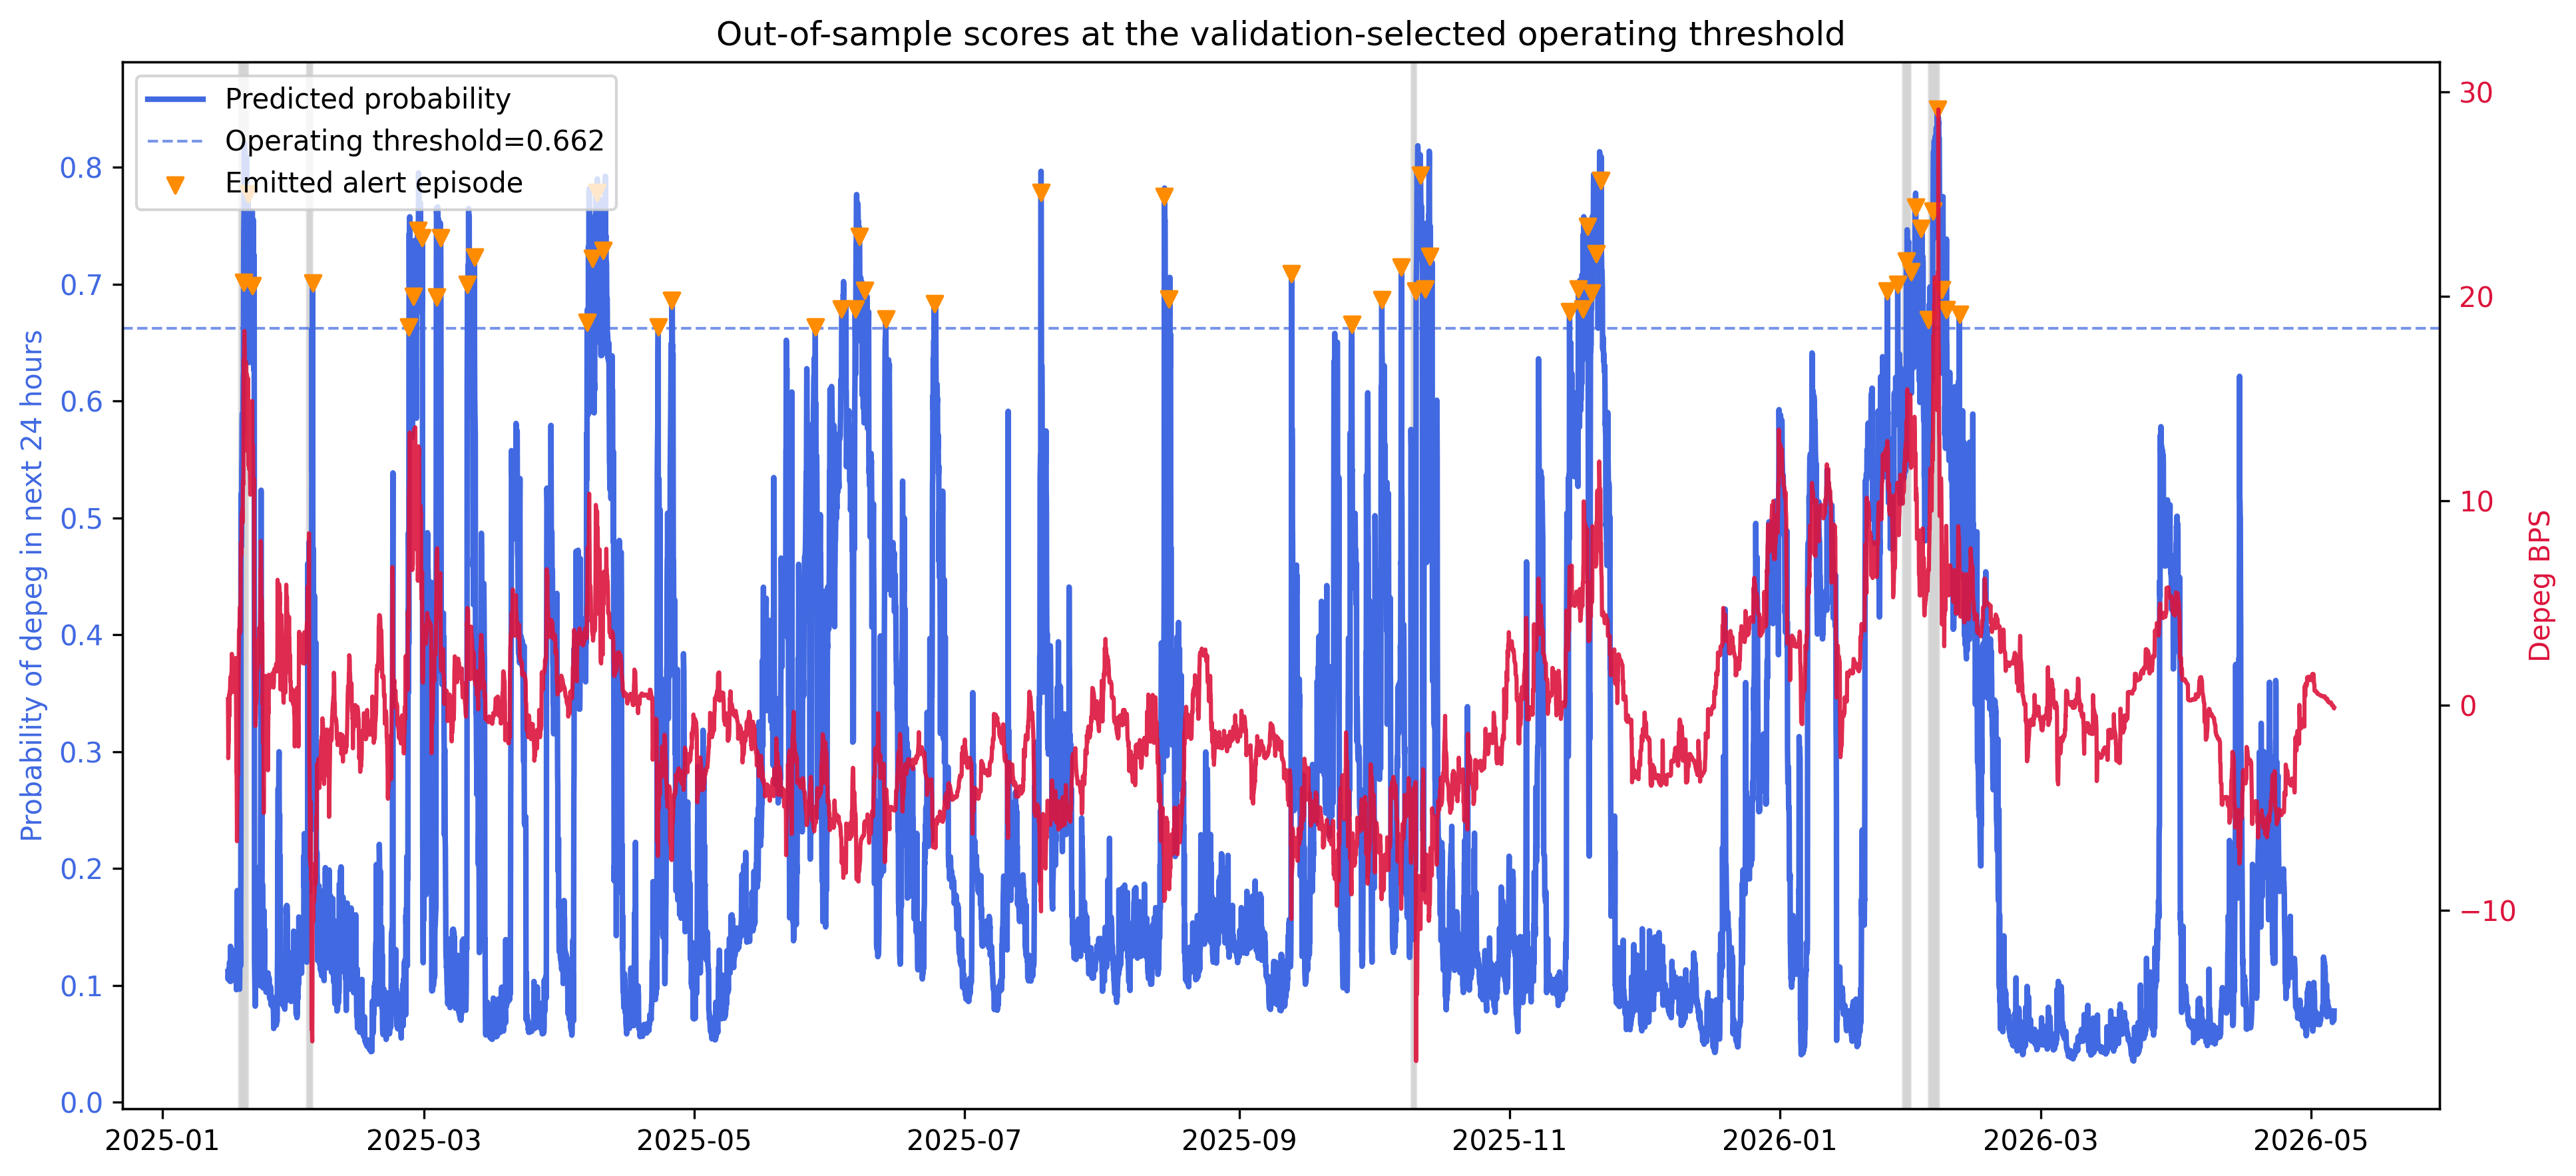
24-hour ahead predicted depeg probability out-of-sample
View the detailed instructions in the README:
8. Early-Warning Classifier Cross Validation/README.mdThe best performing Early Warning model is selected from the previous quantlet. SHAP explanations are produced to explain its outputs, including global summaries and local waterfalls. SHAP importance of Economic groups is highlighted.
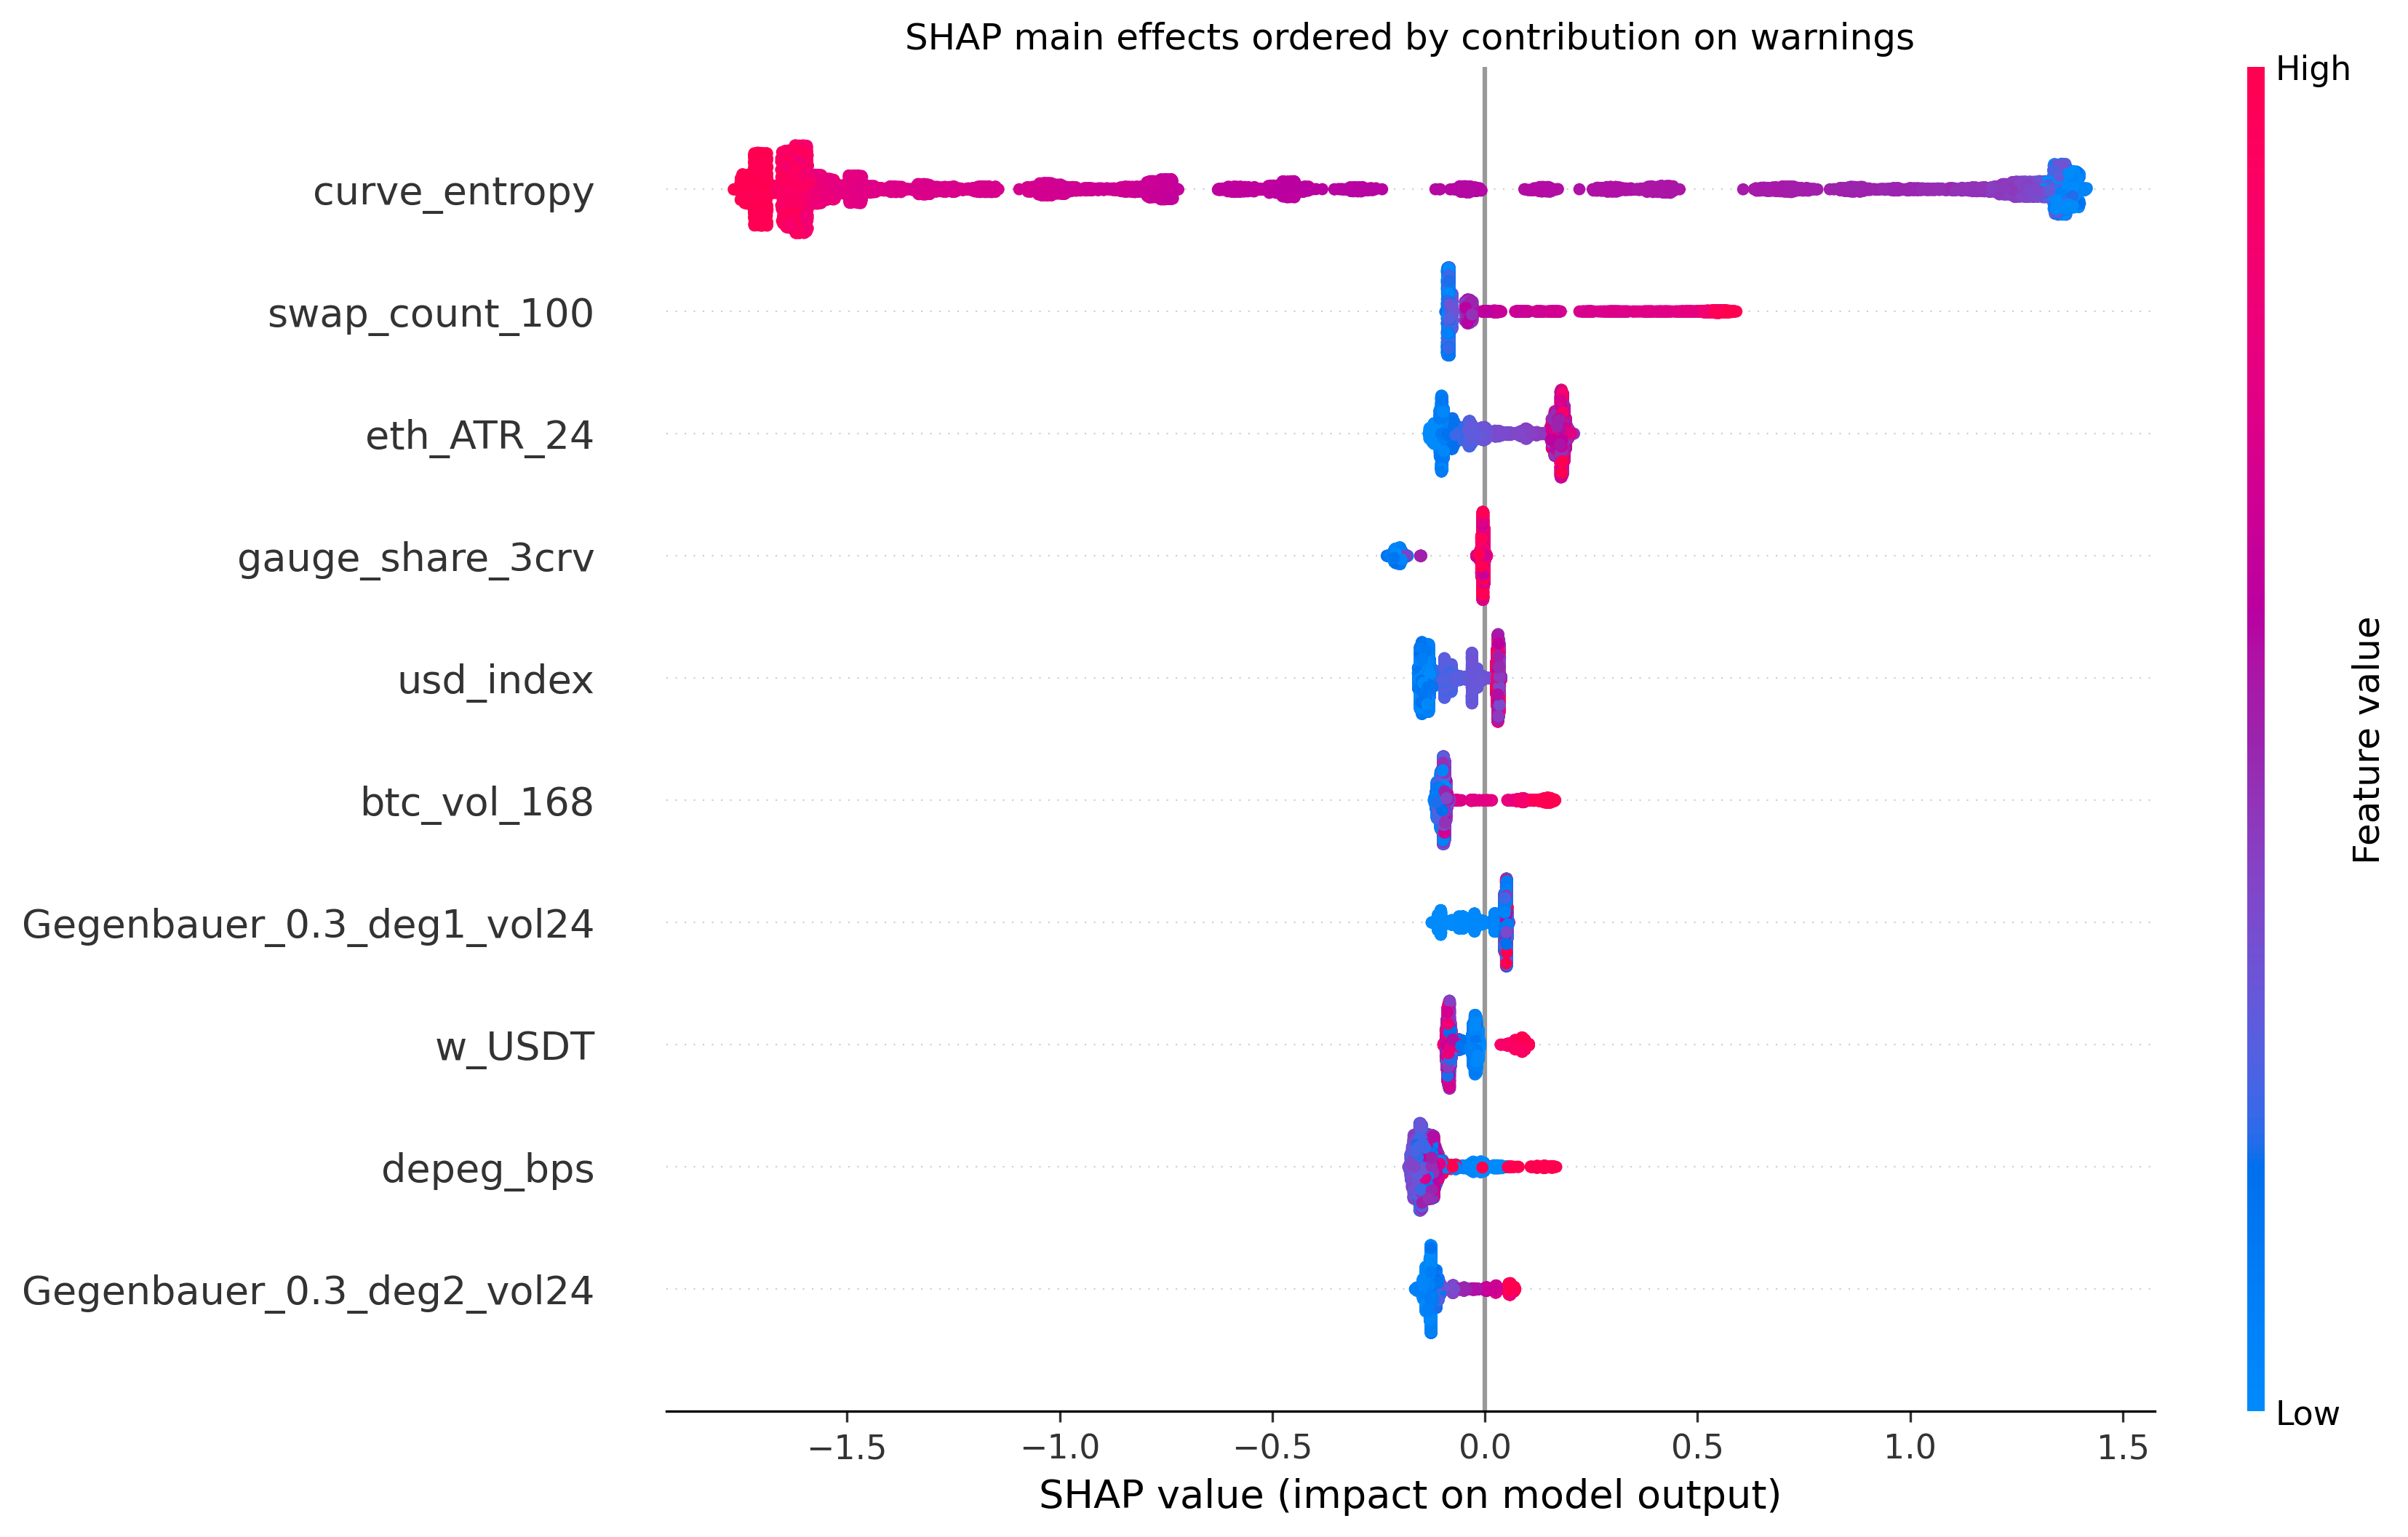
Summary plot of SHAP feature attribution
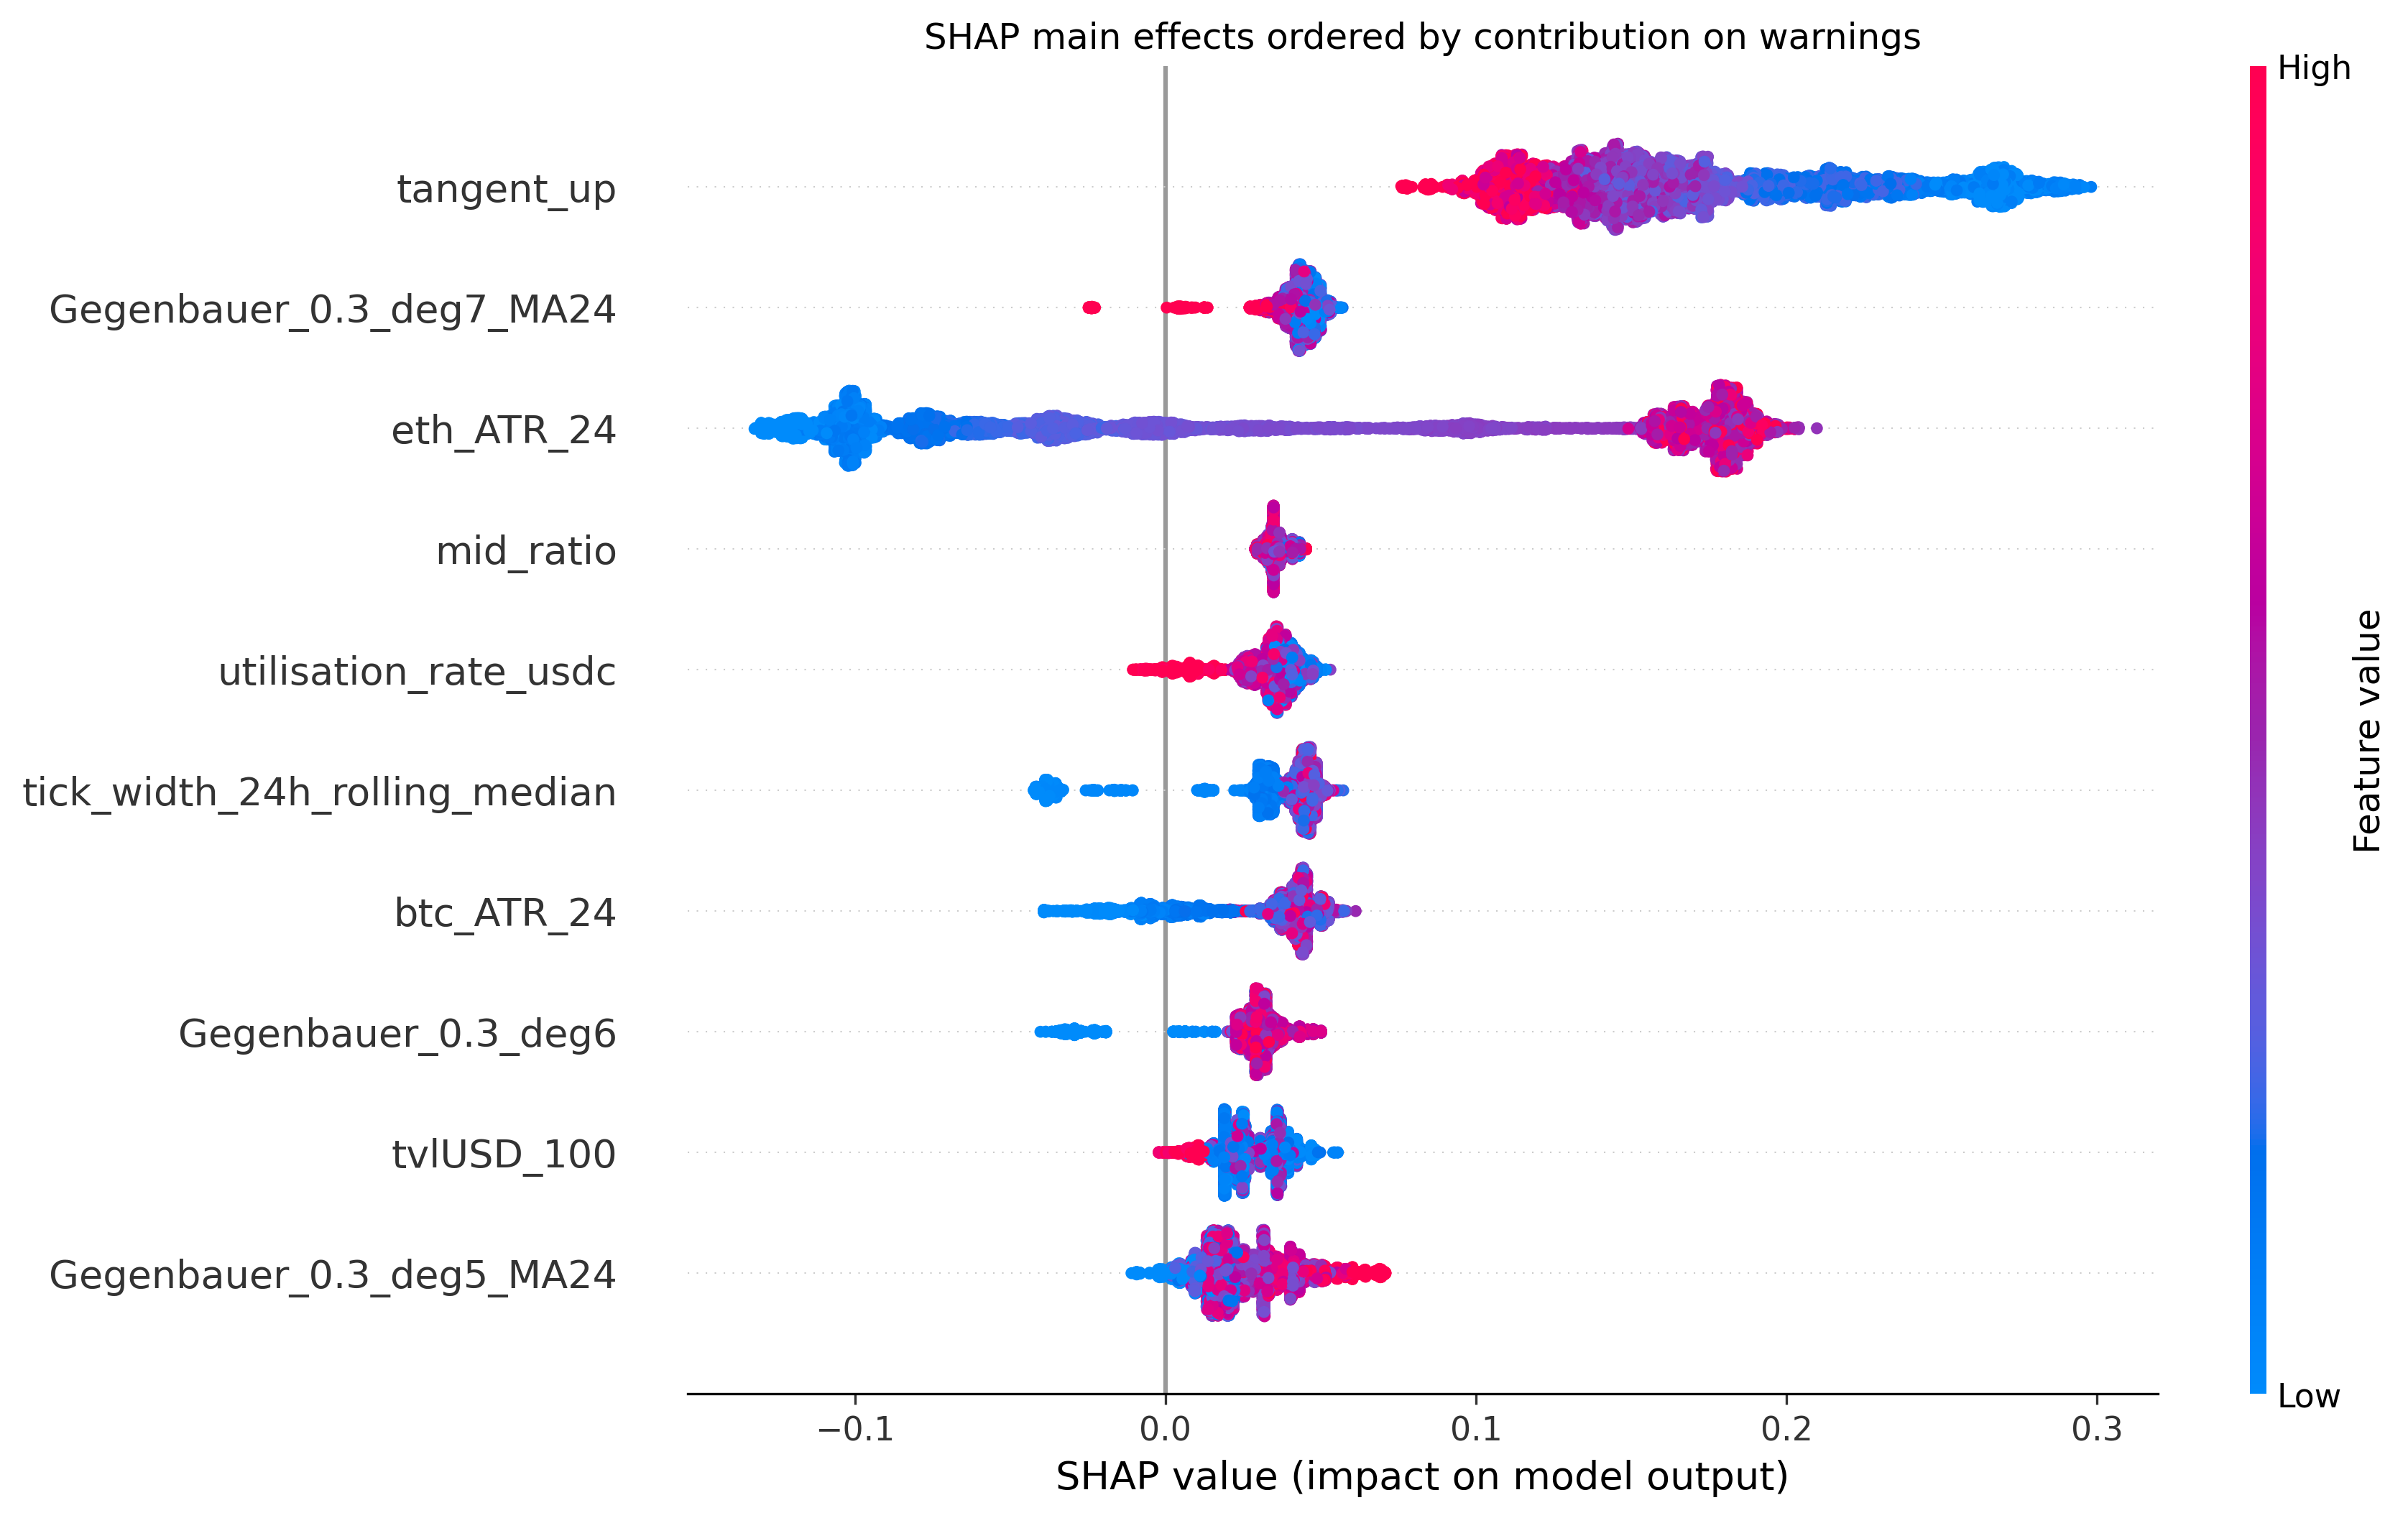
Summary plot of SHAP feature attribution to depeg alerts
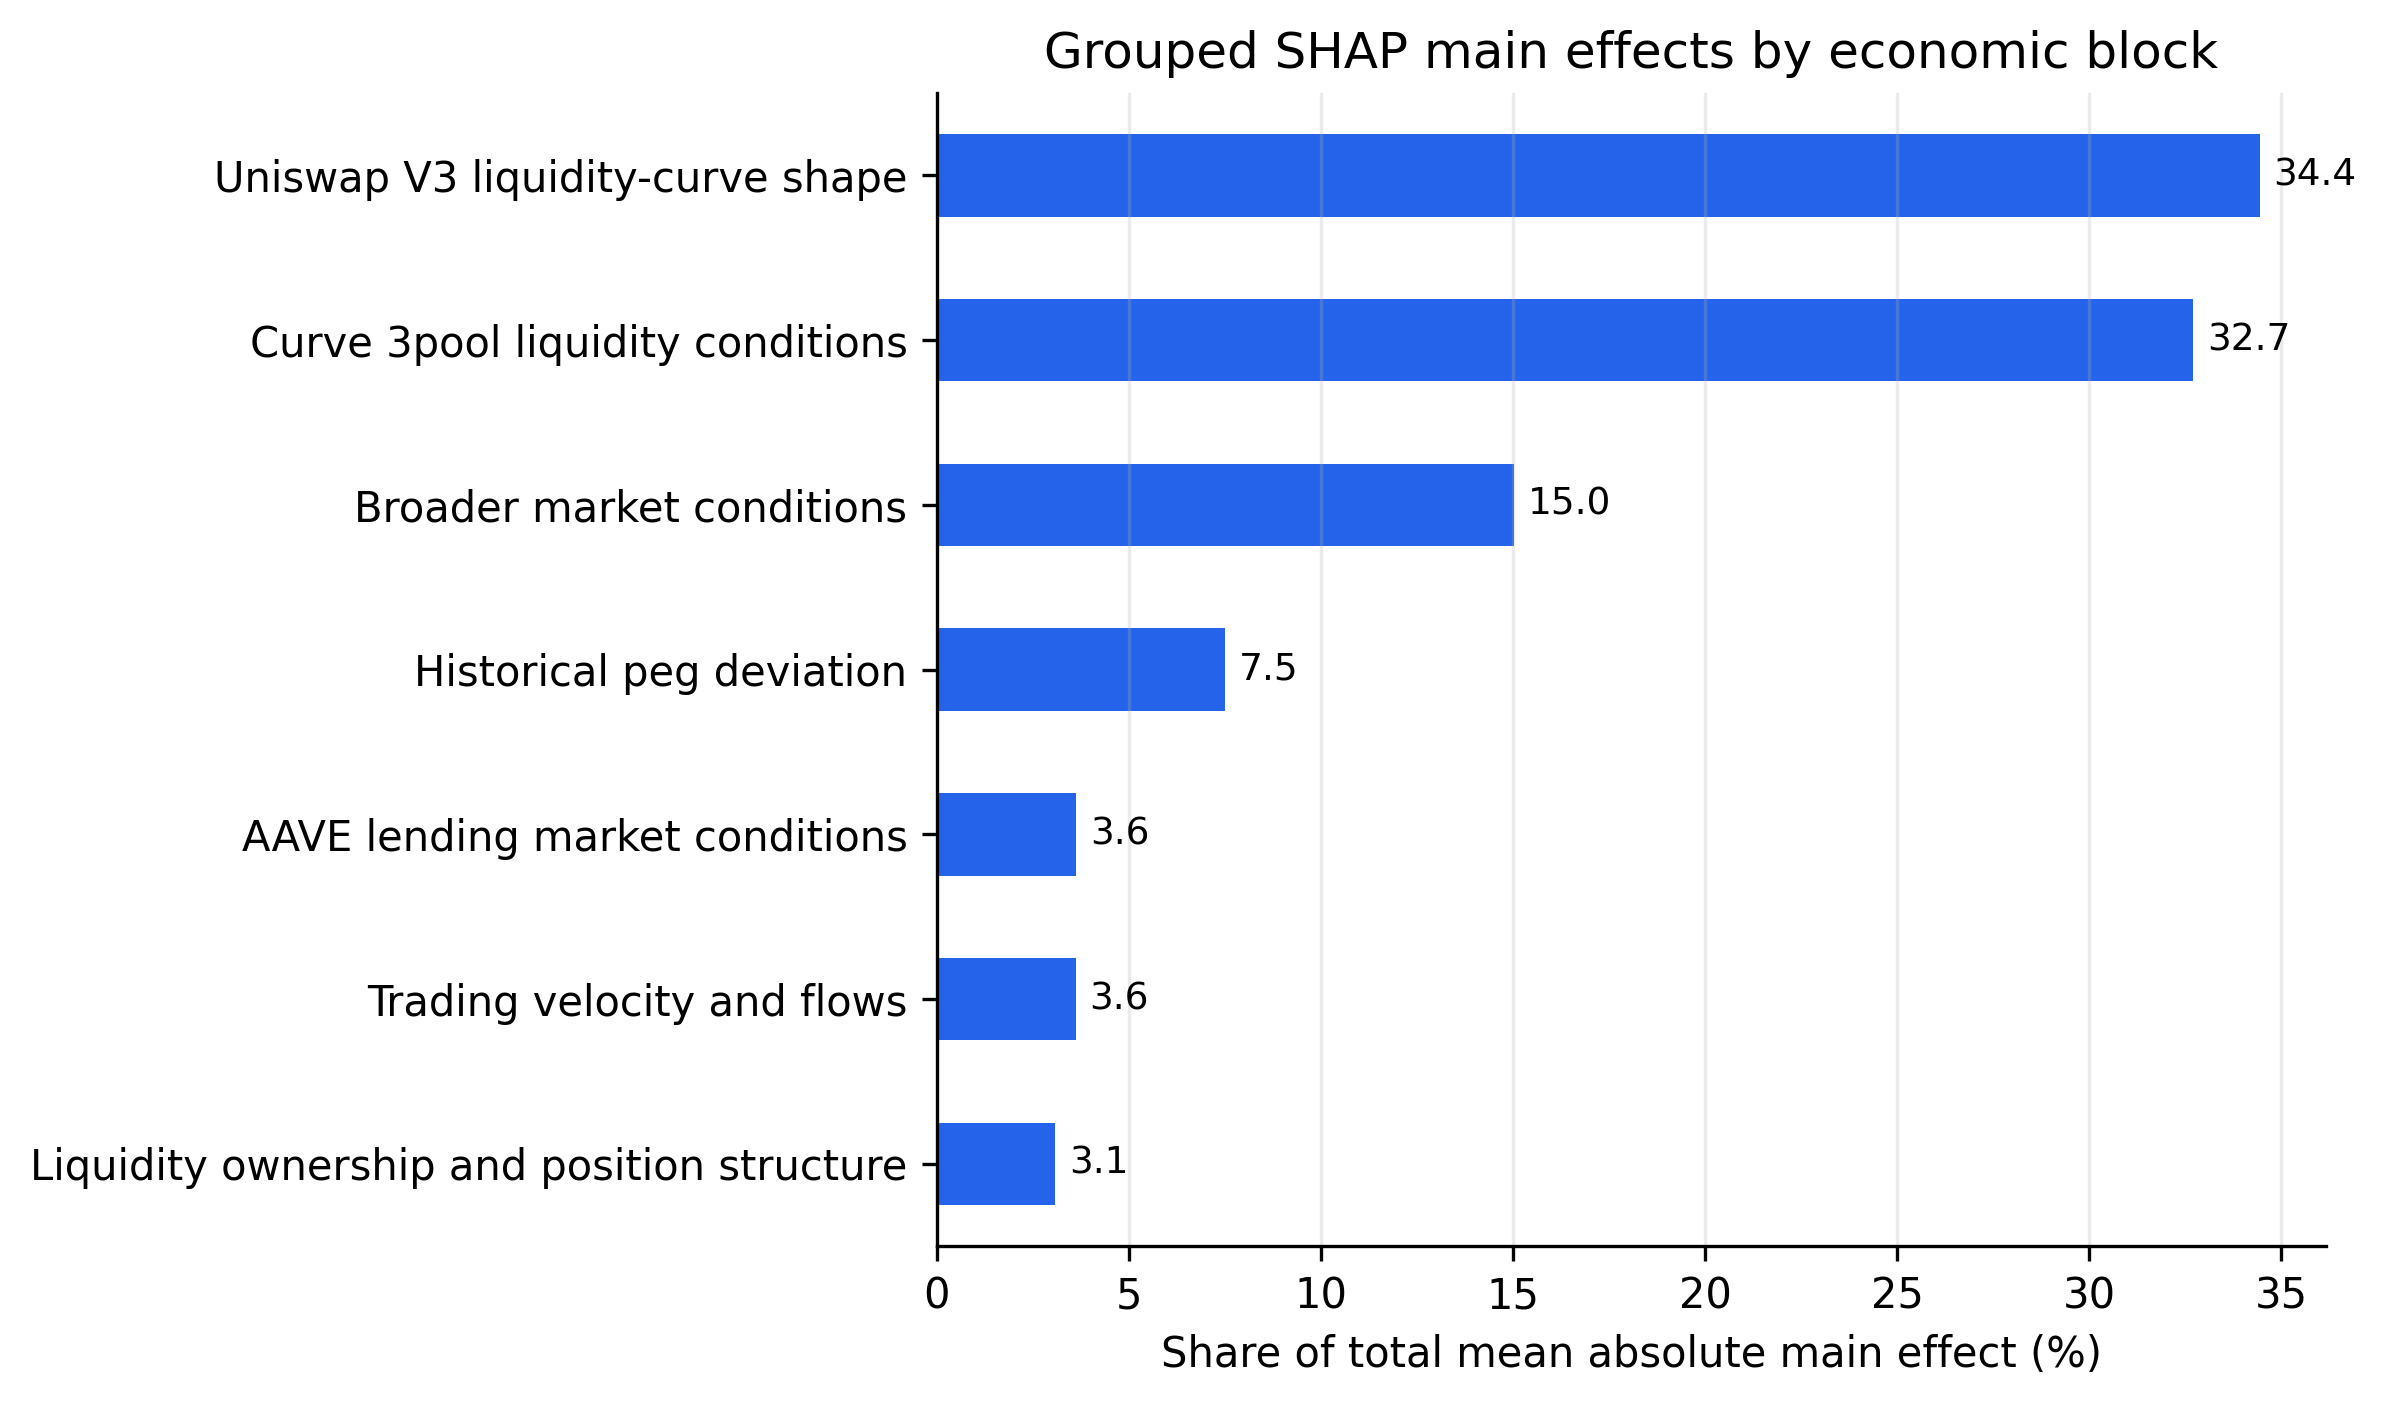
SHAP attribution by economic feature group
View the detailed instructions in the README:
9. SHAP explanations of Early Warning Model/README.mdIn this quantlet we evaluate the distribution of stablecoin depeg basis points. ARIMA/GARCH residuals show poor fit against Gaussian/Student's t innovations. In order to circumvent this issue we train a Neural Network to regress the quantile function in a non-distributional manner. We show the use of both Chebyshev and I-spline bases for quantile function regression, and their advantages/drawbacks. We also introduce the threshold weighted CRPS used to favor rare extreme events in the diustributional calibration. Lastly we showcase the addition of spliced GPD tails for modeling extreme events/ closed form VaR+ES estimation.
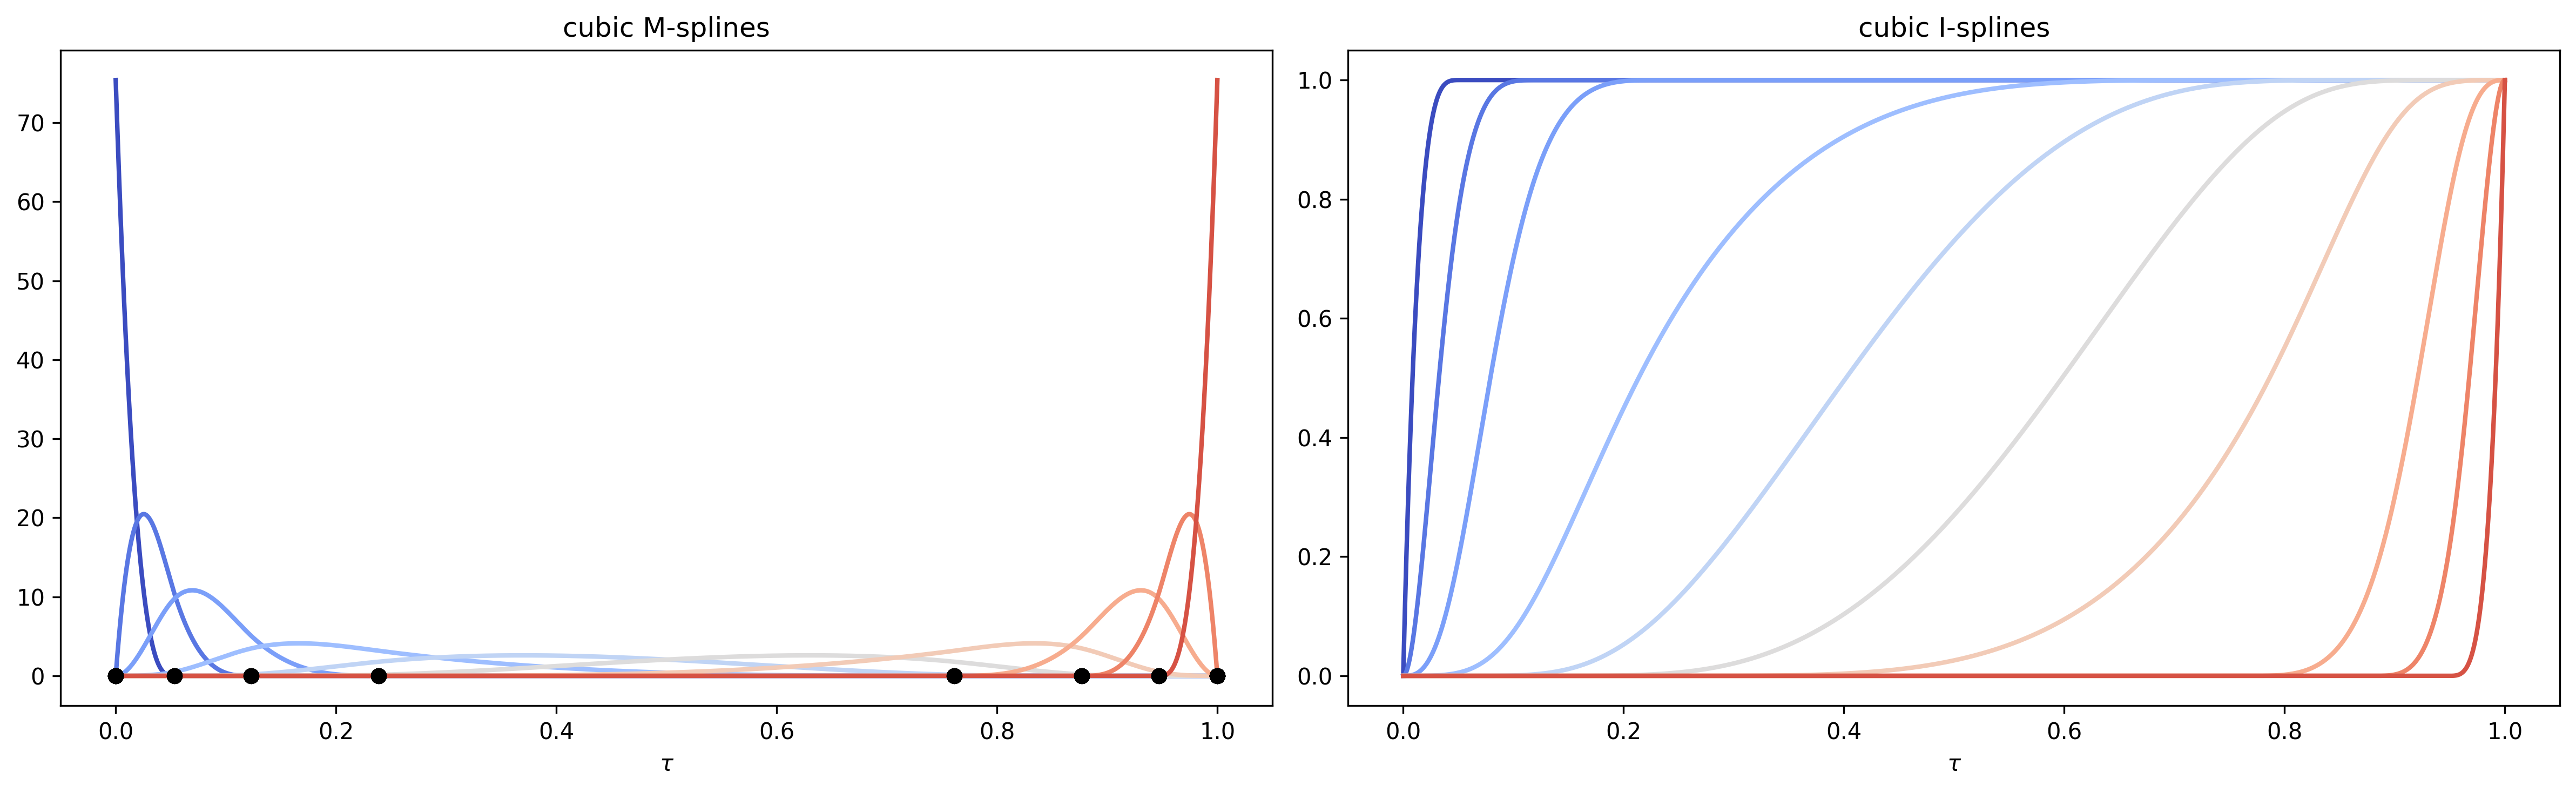
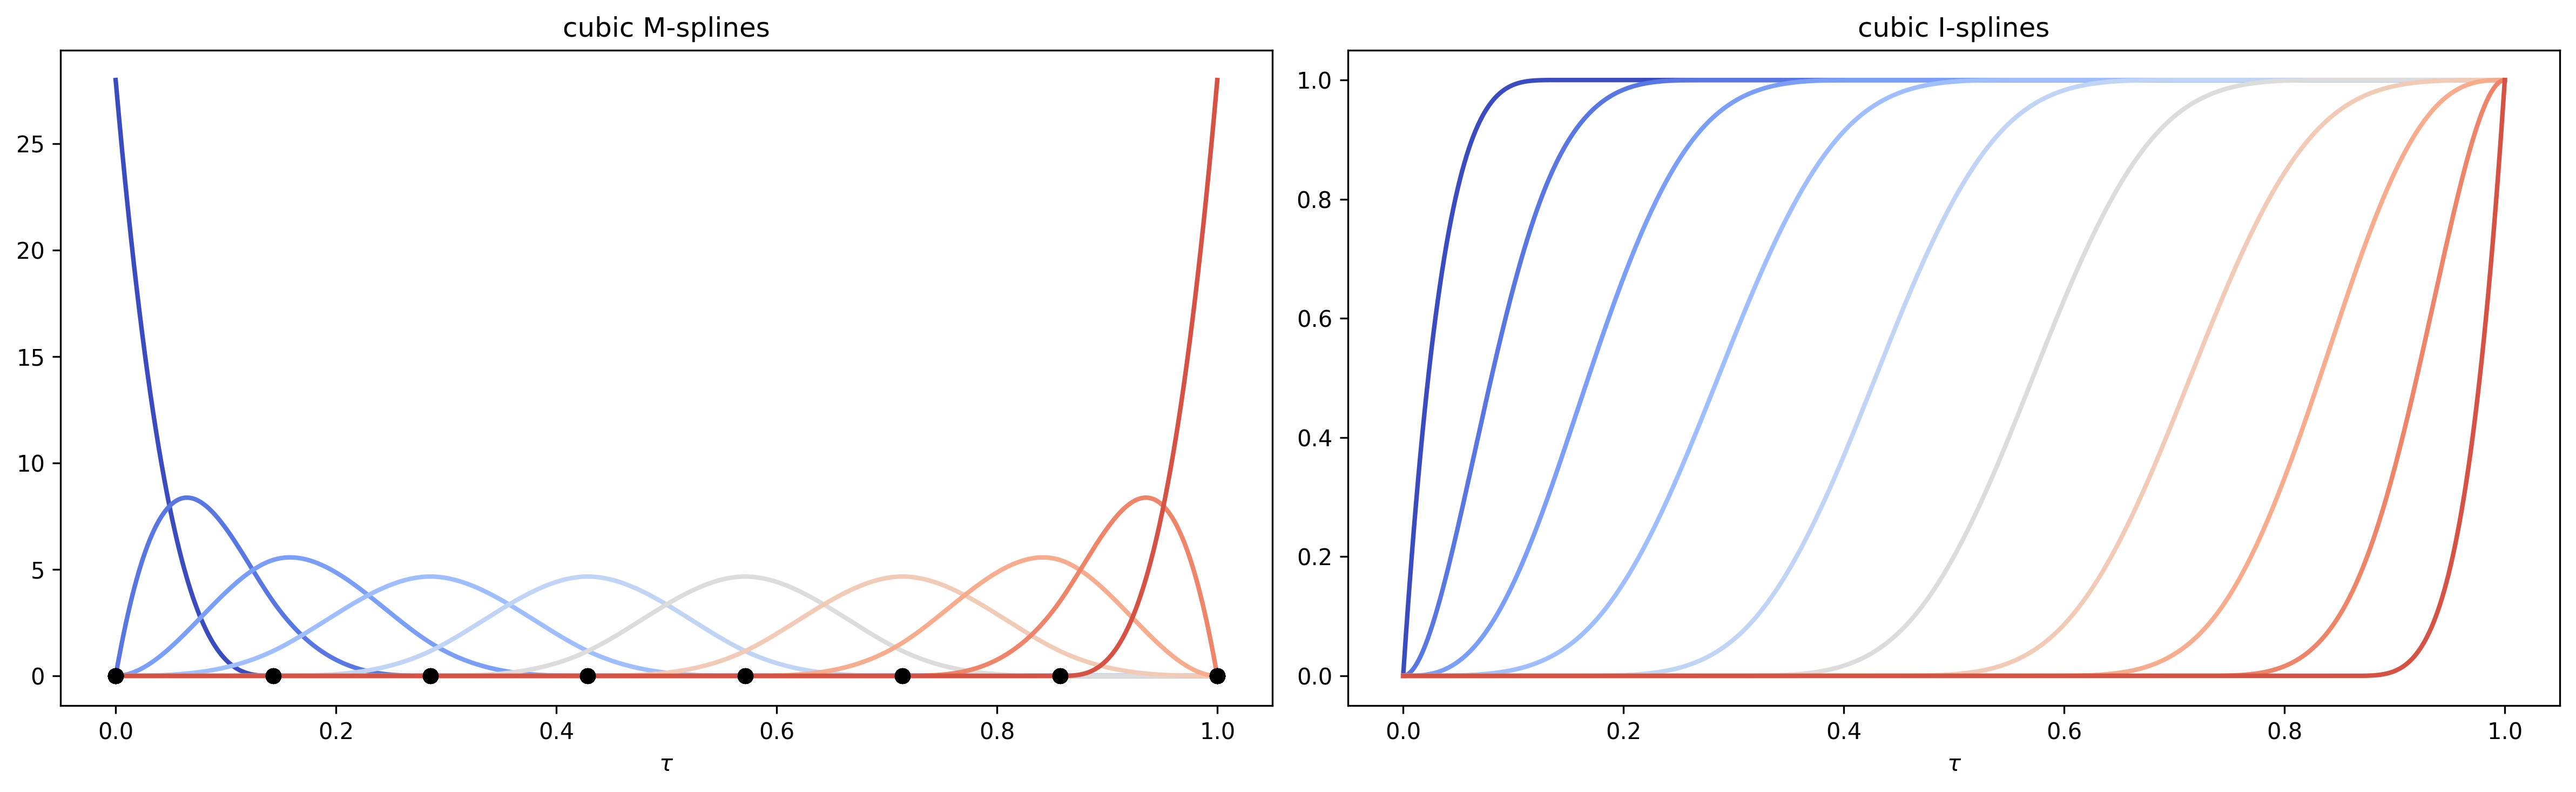
I spline bases generated with uniform and power-tails knots
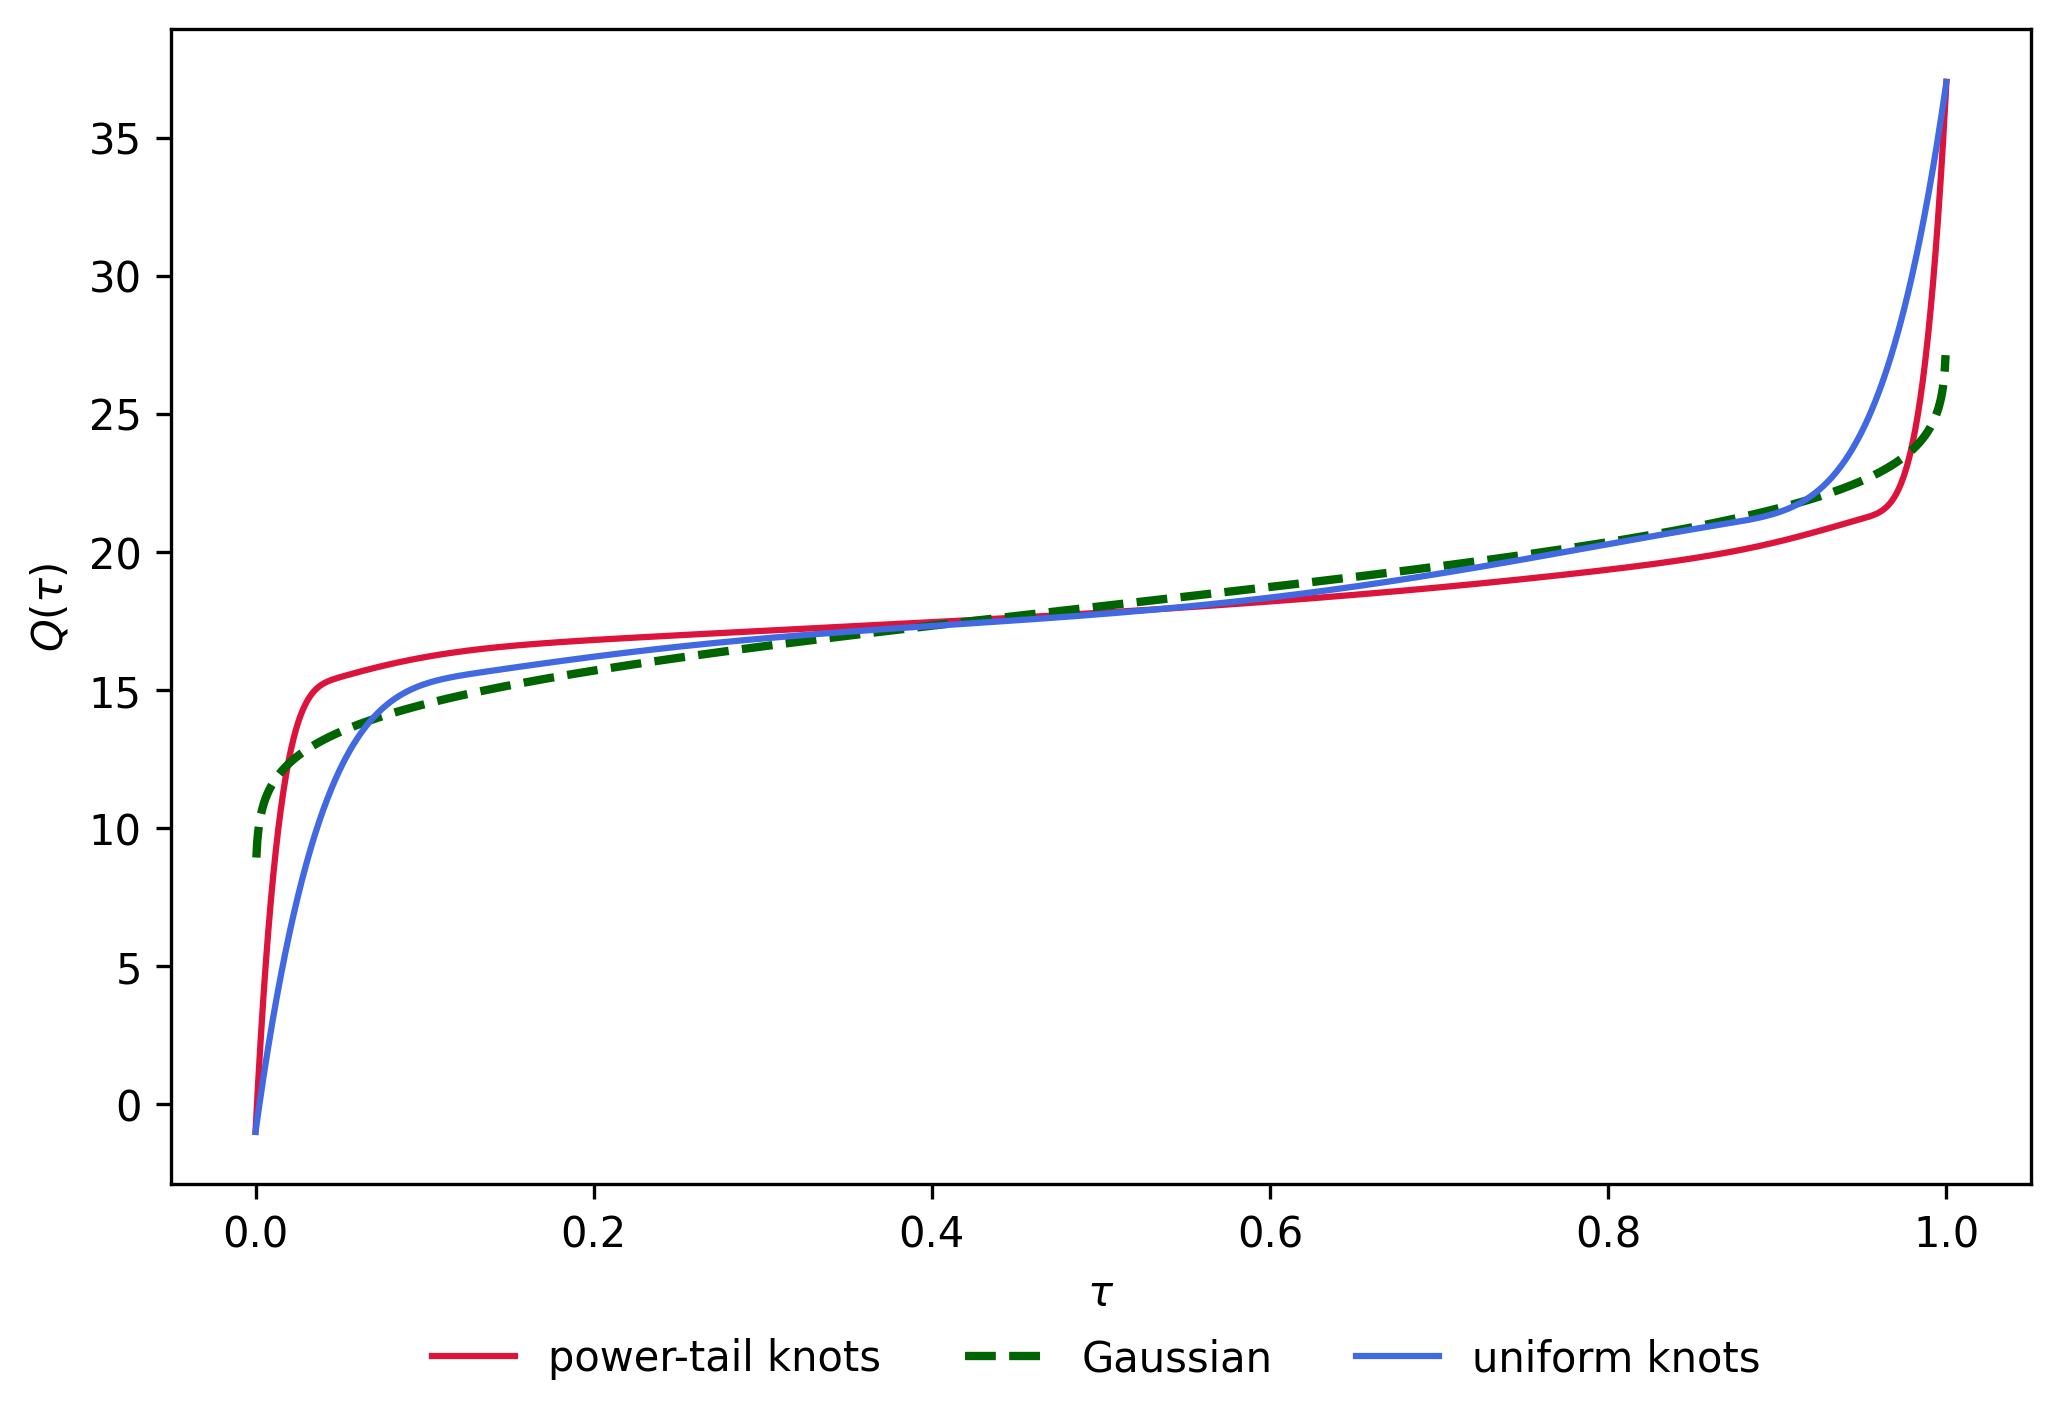
Quantile function tail focus based on knot density
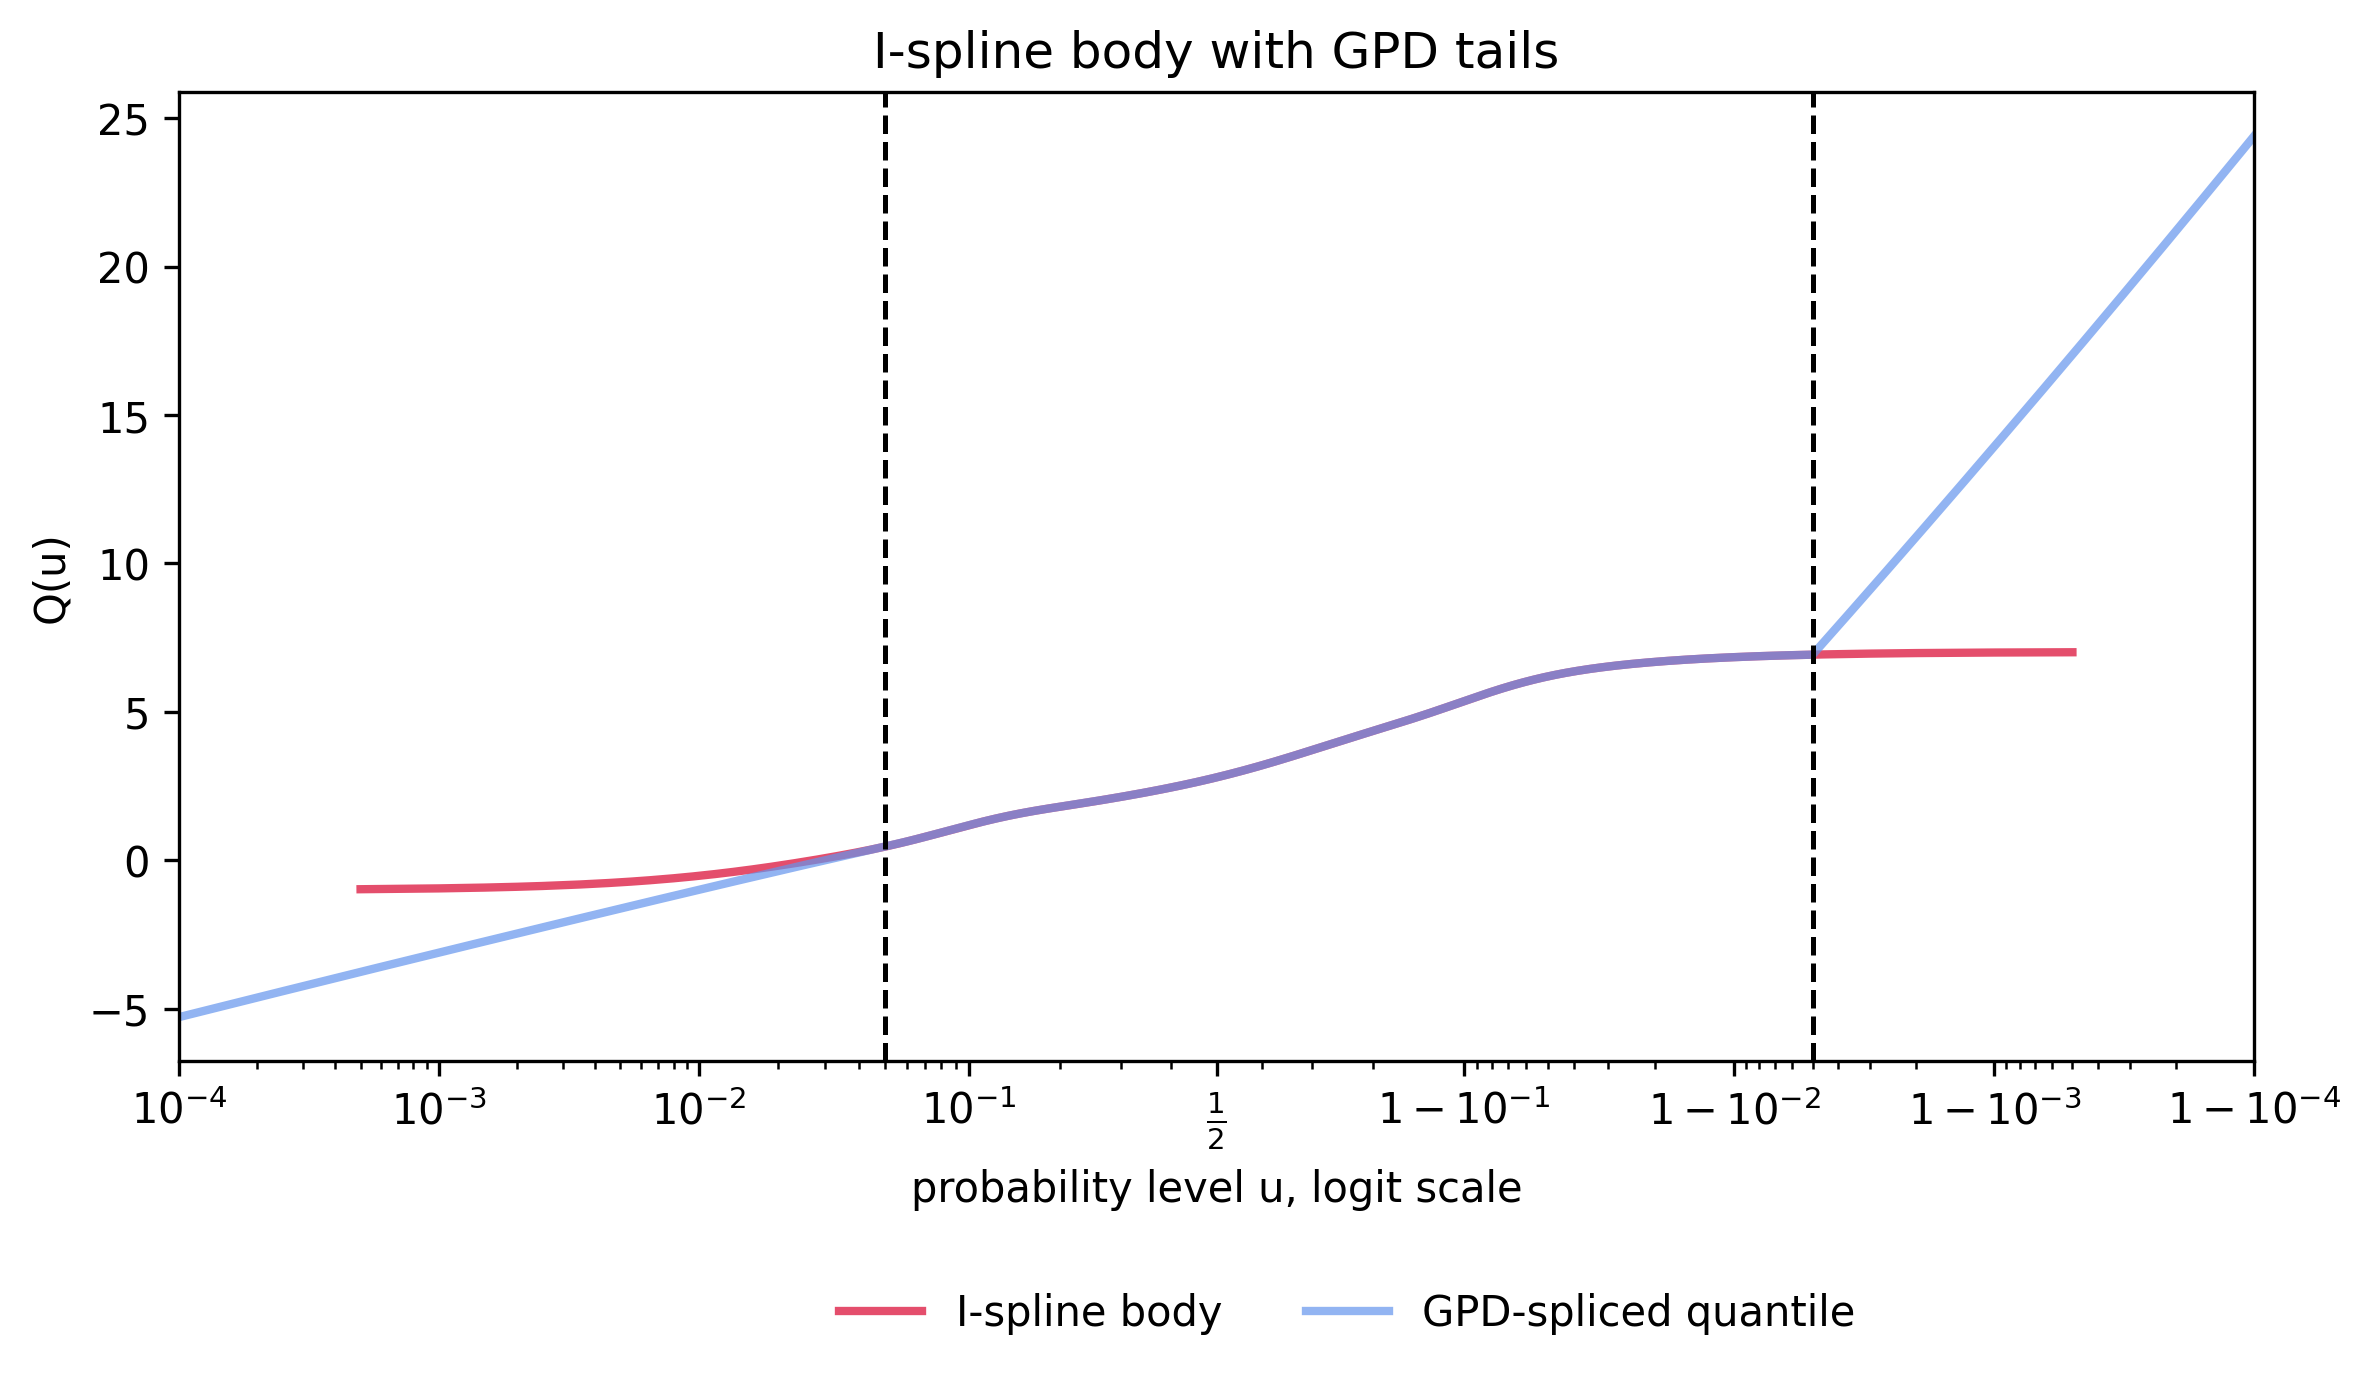
Spliced Quantile function with parametric GPD tails
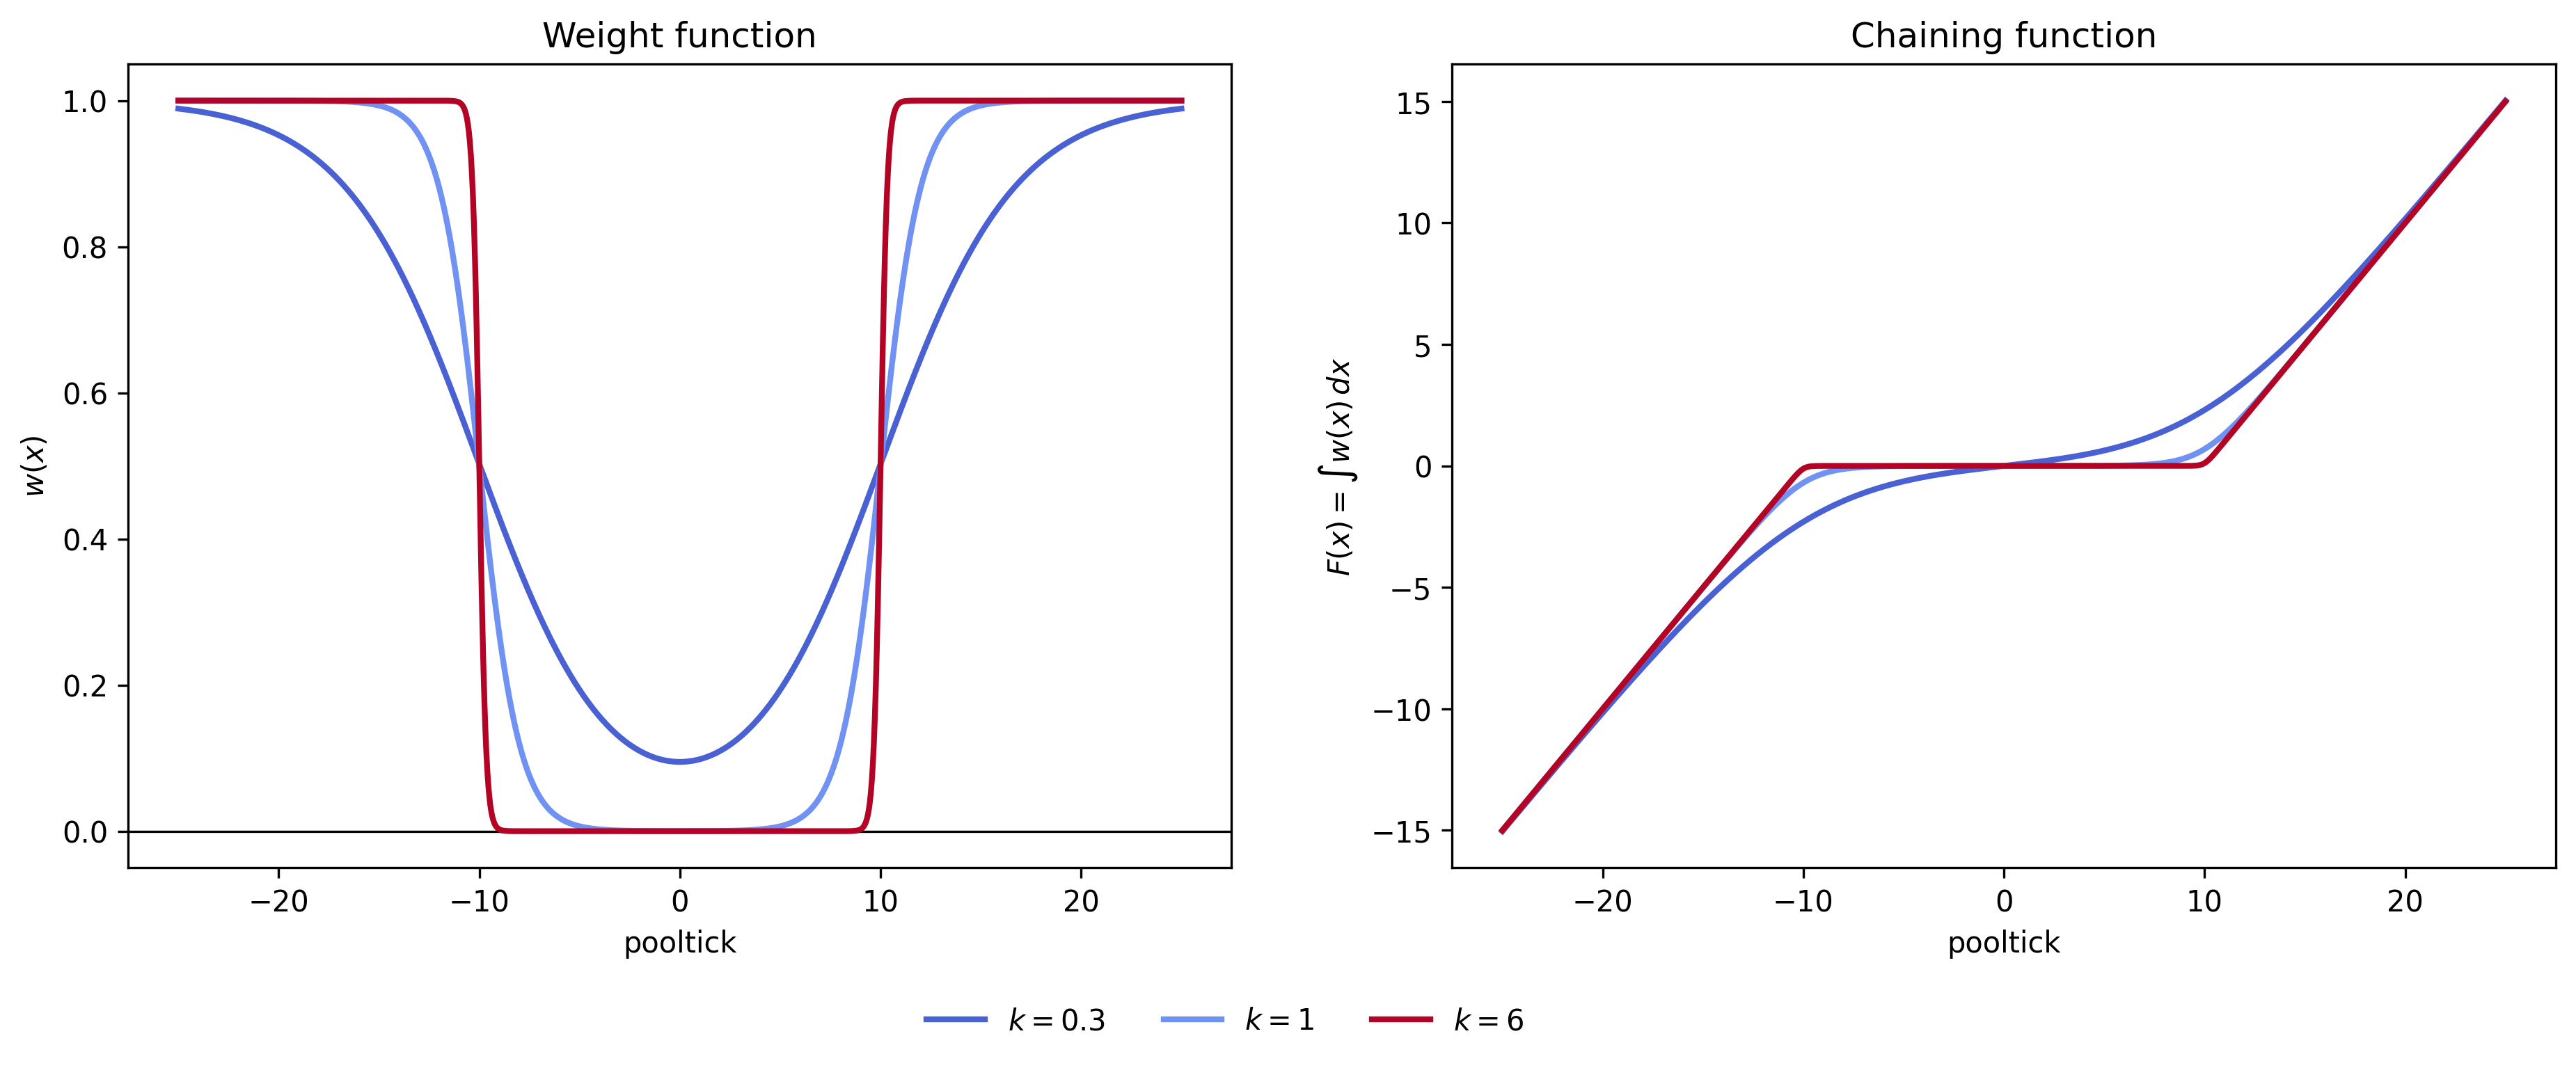
Weight and Chaining function of the threshold weighted CRPS
Run the notebook:
10. Parametric quantile function characterisation/code.ipynb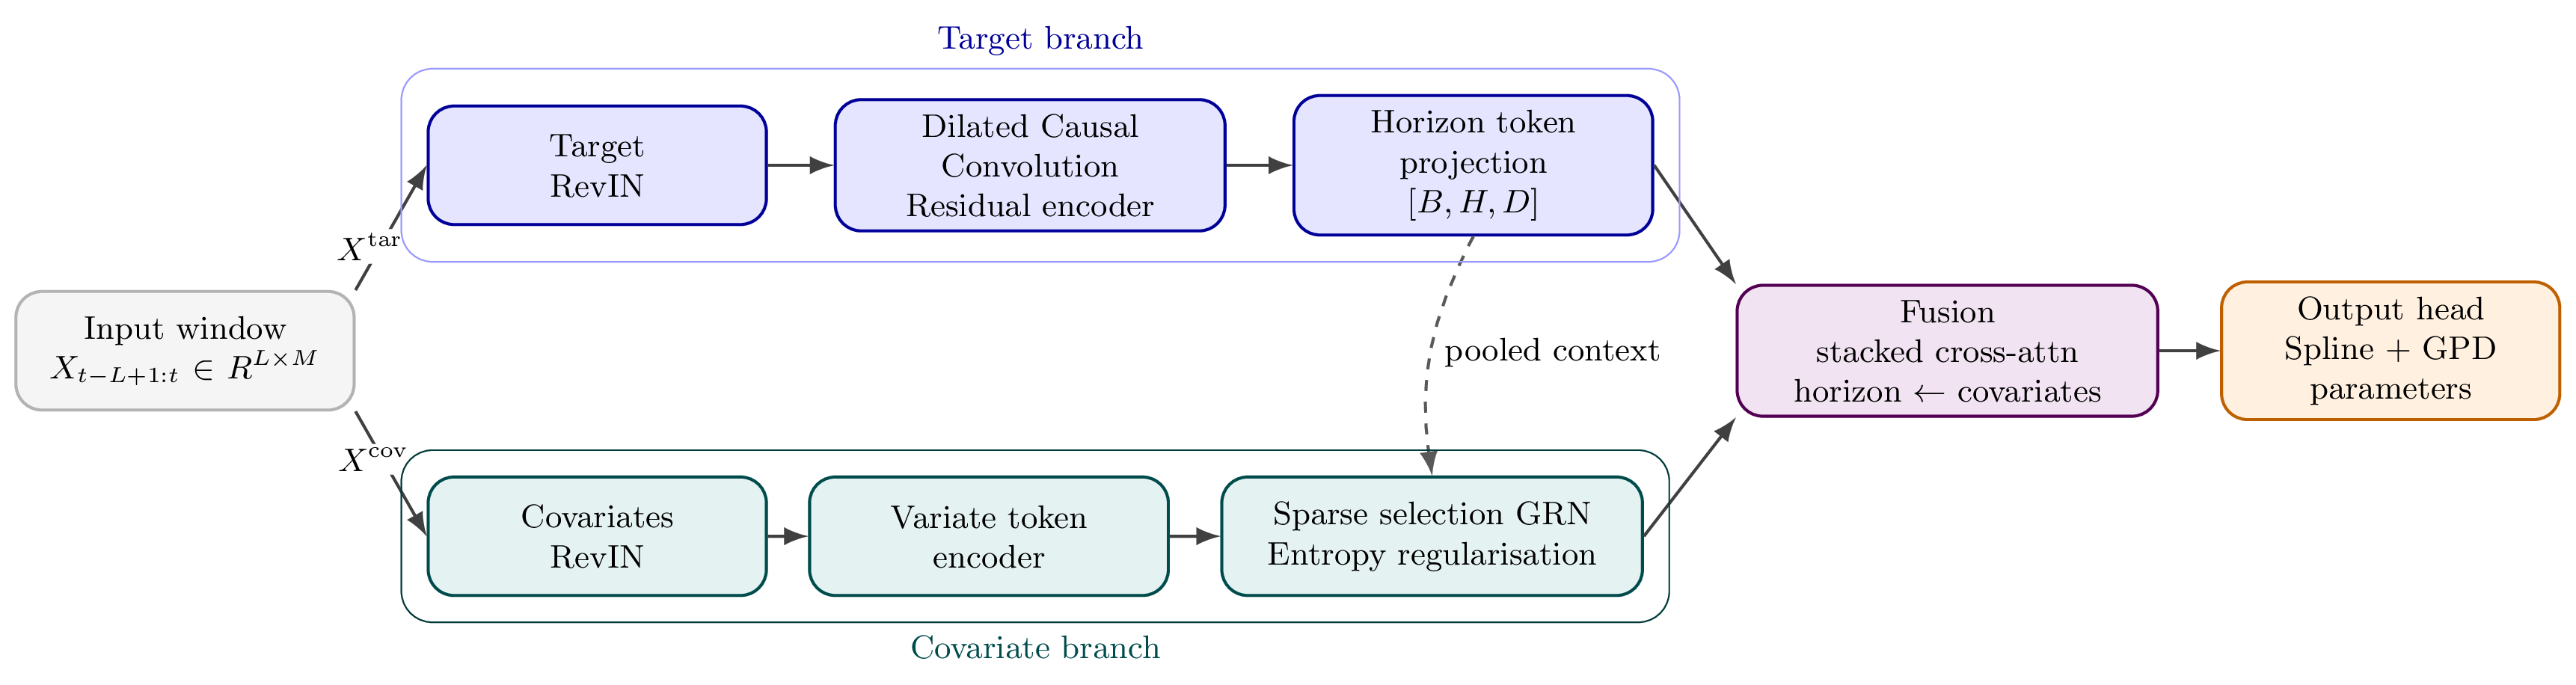
Our custom Neural Network Forecasting architecture
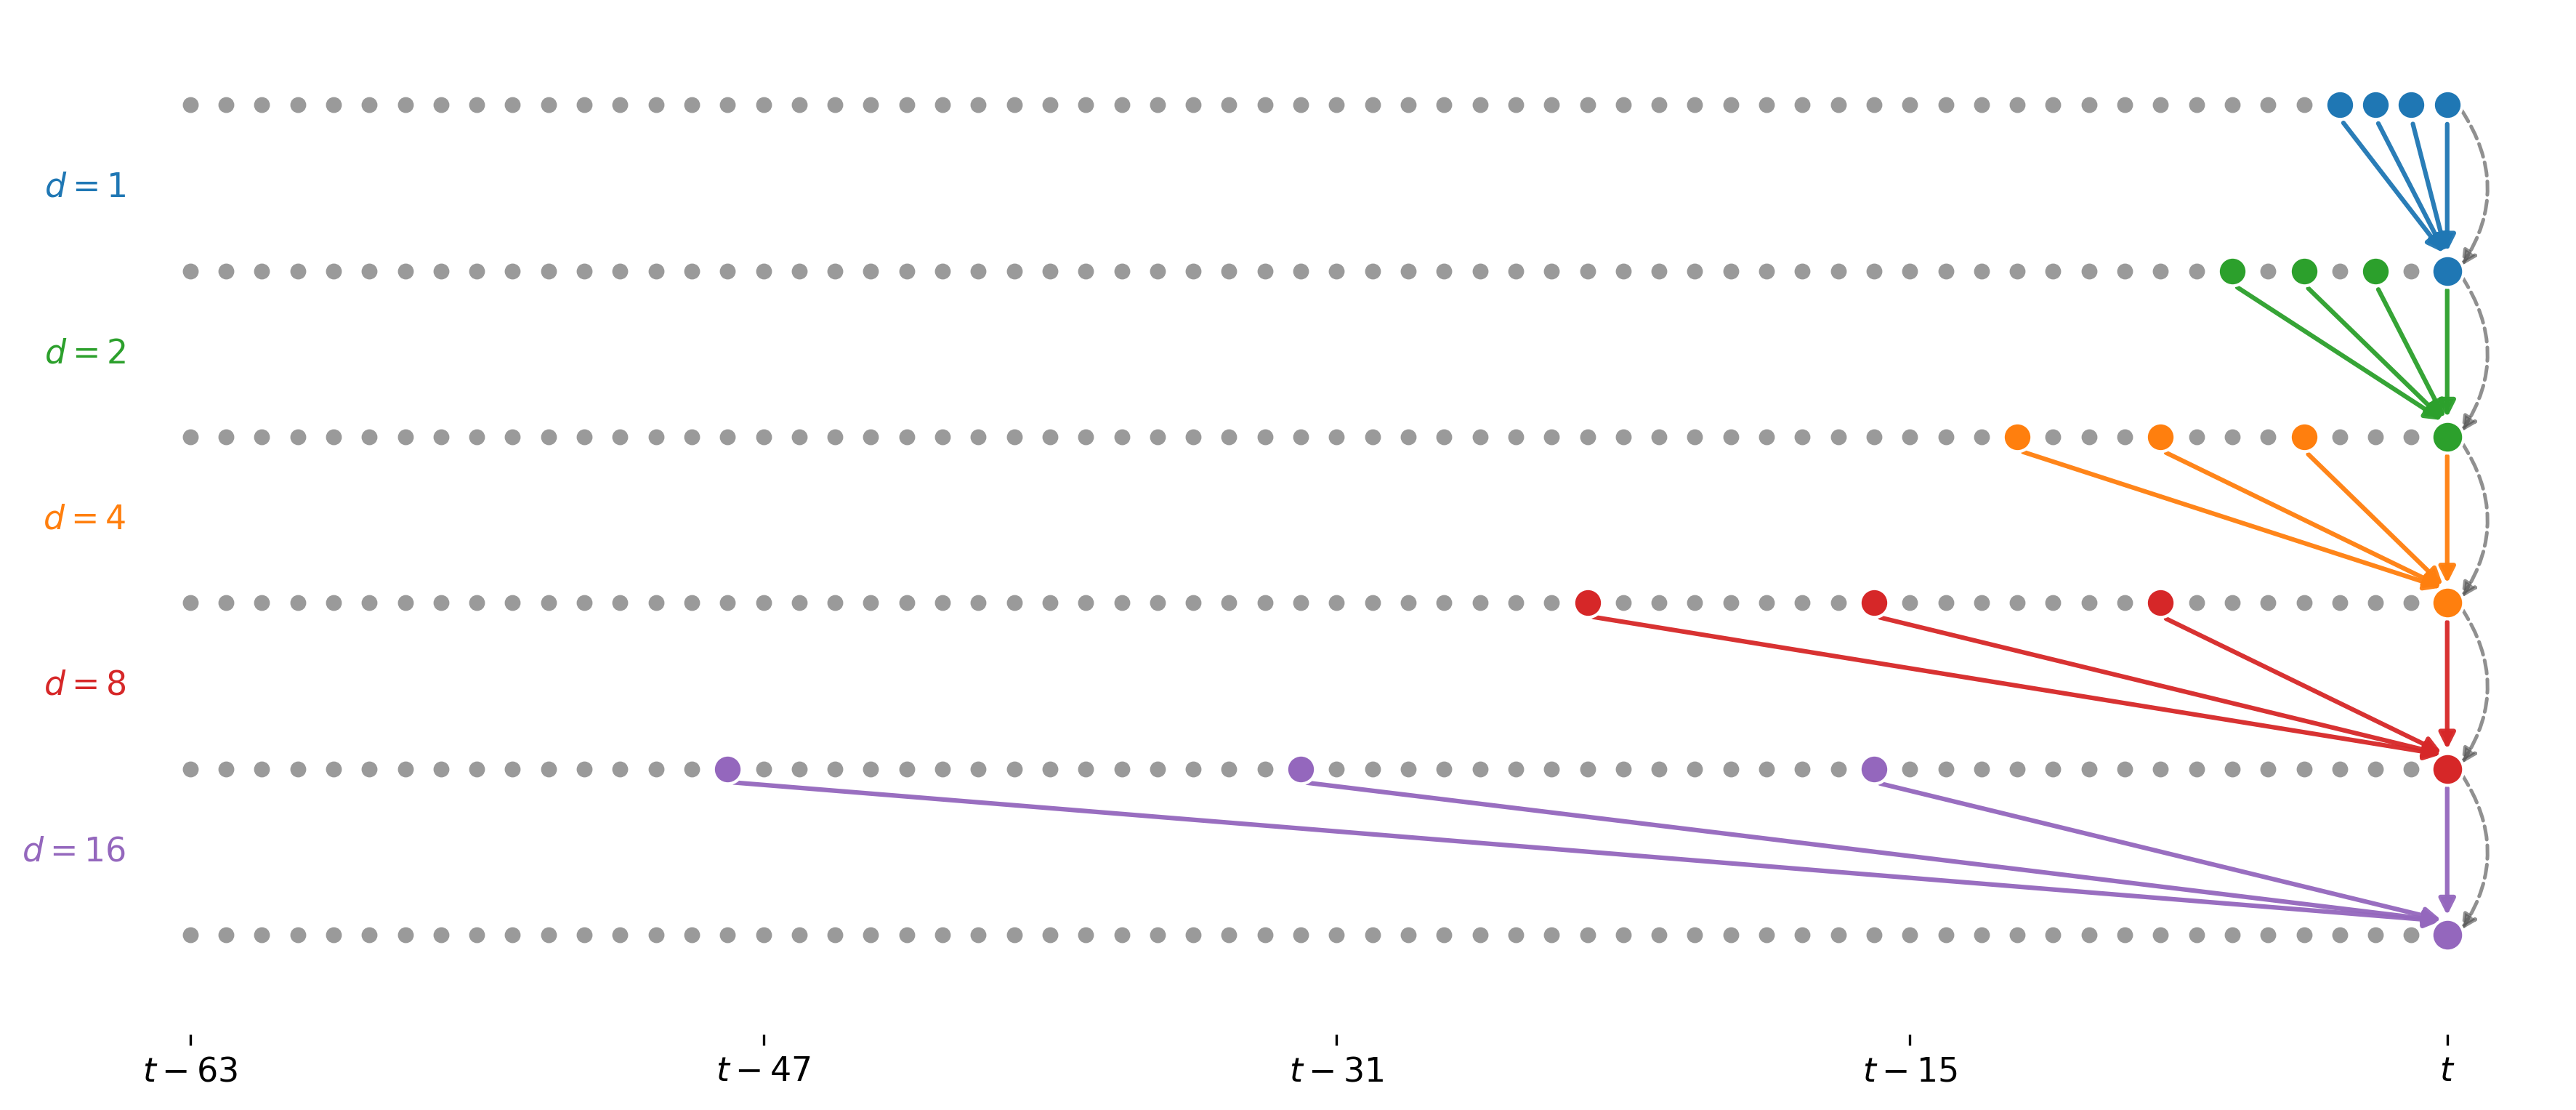
Dilated TCN target encoder
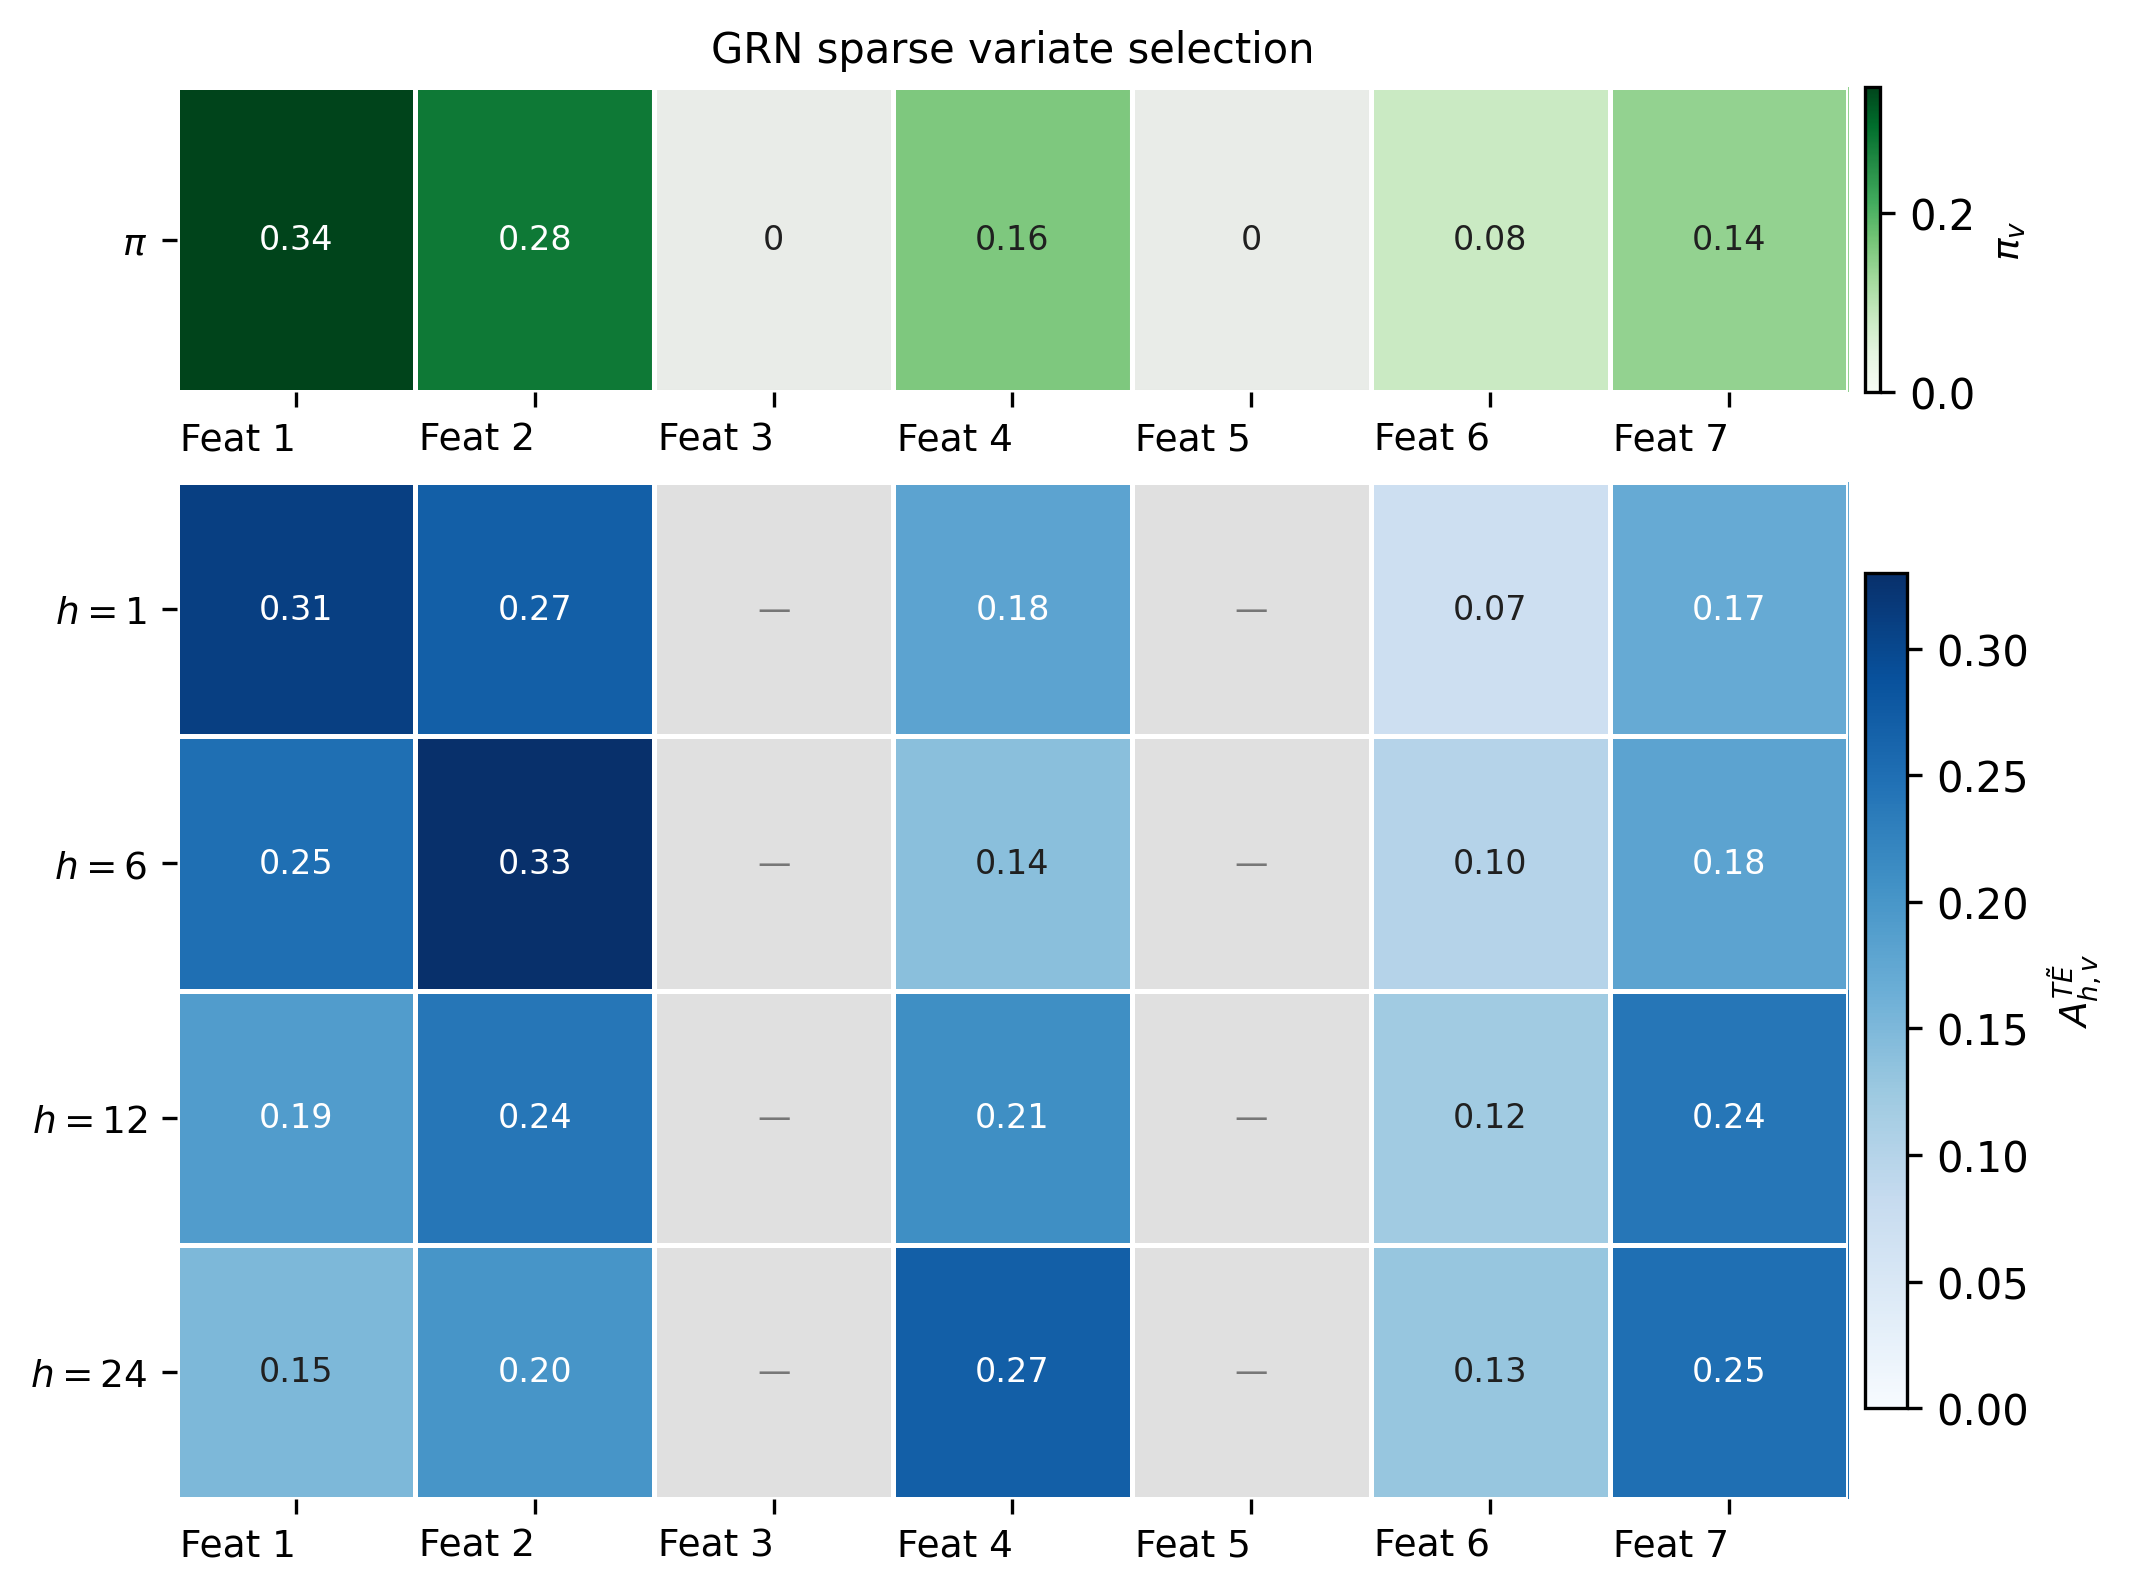
Sparse variate cross attention with selection weights.
Run the notebook:
11. Forecasting architecture/code.ipynbThis repo contains large forecast artifacts, stored in a release for ease of reproducibility.In order to populate a clone, download and extract all the release packages; their stored paths put each file back in the expected folder:
section='12. Evaluation of Probabilistic Forecasts'
downloads="$(mktemp -d)"
gh release download section12-forecasts-v1 \
  --repo QuantLet/onchain-insights \
  --pattern 'section12-*.tar.gz' \
  --dir "$downloads"
for asset in "$downloads"/section12-*.tar.gz; do
  tar -xzf "$asset" -C "$section"
done
This requires the GitHub CLI (gh) authenticated to an account with access to
the repository.
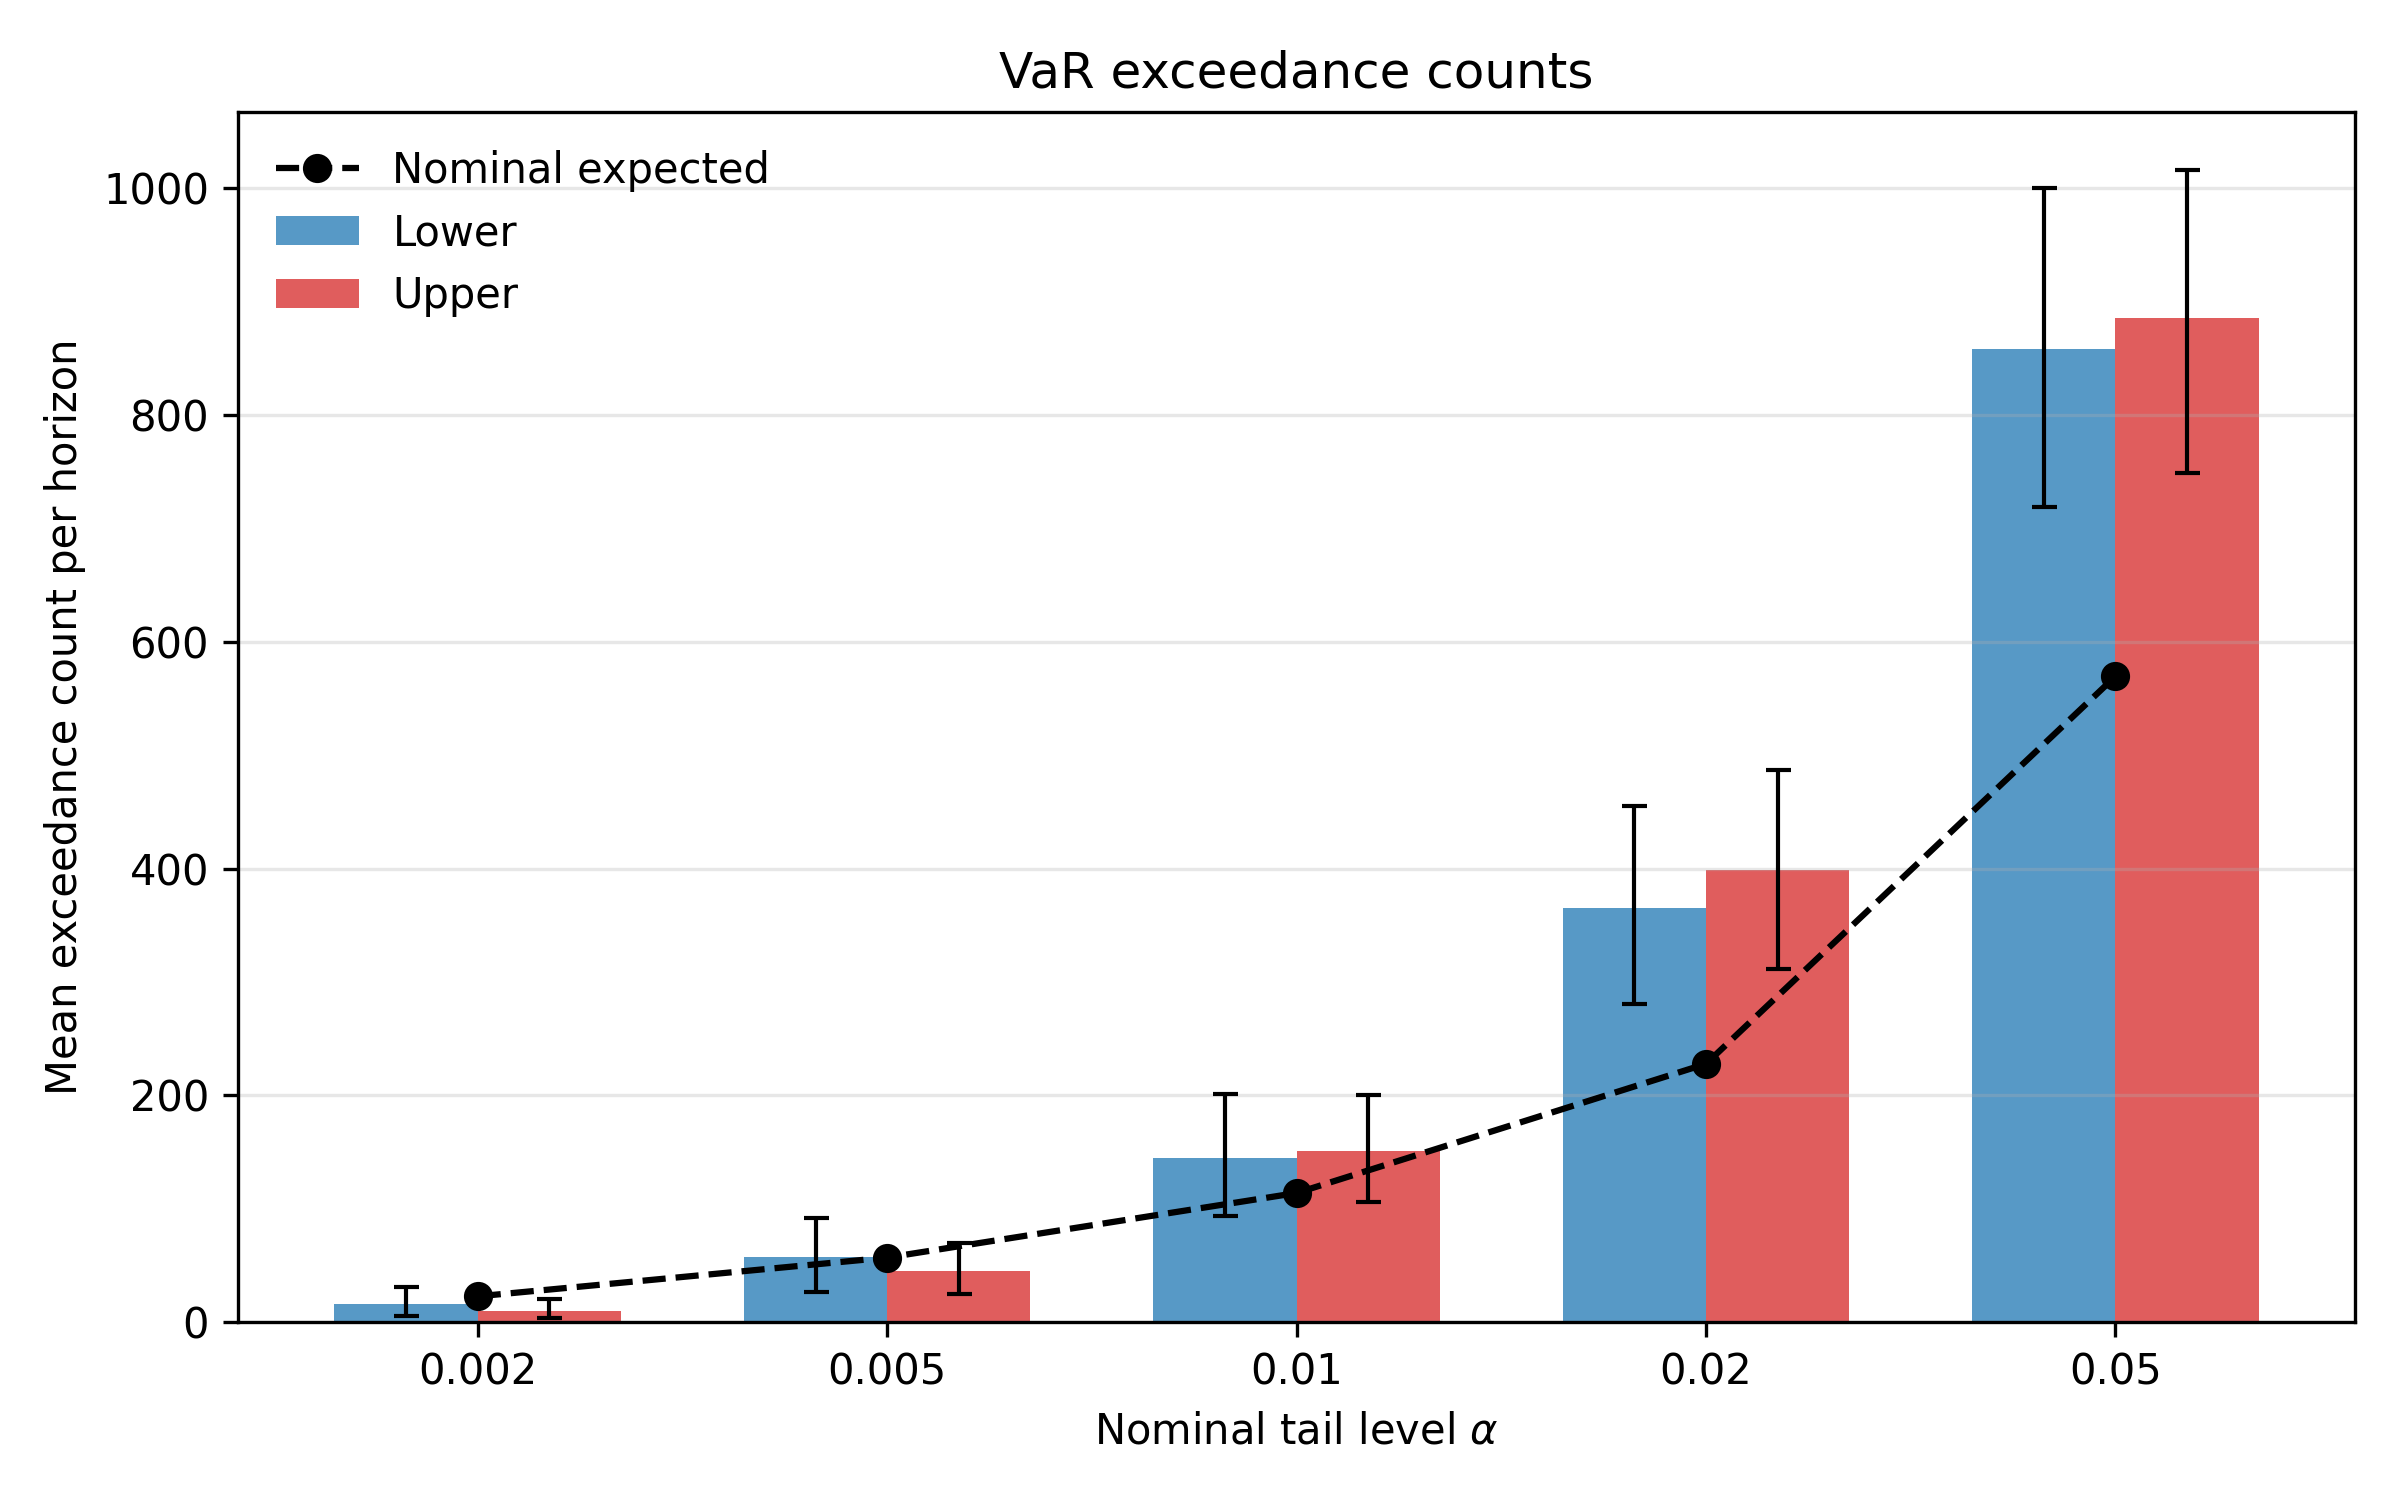
Value at Risk exceedance count plot
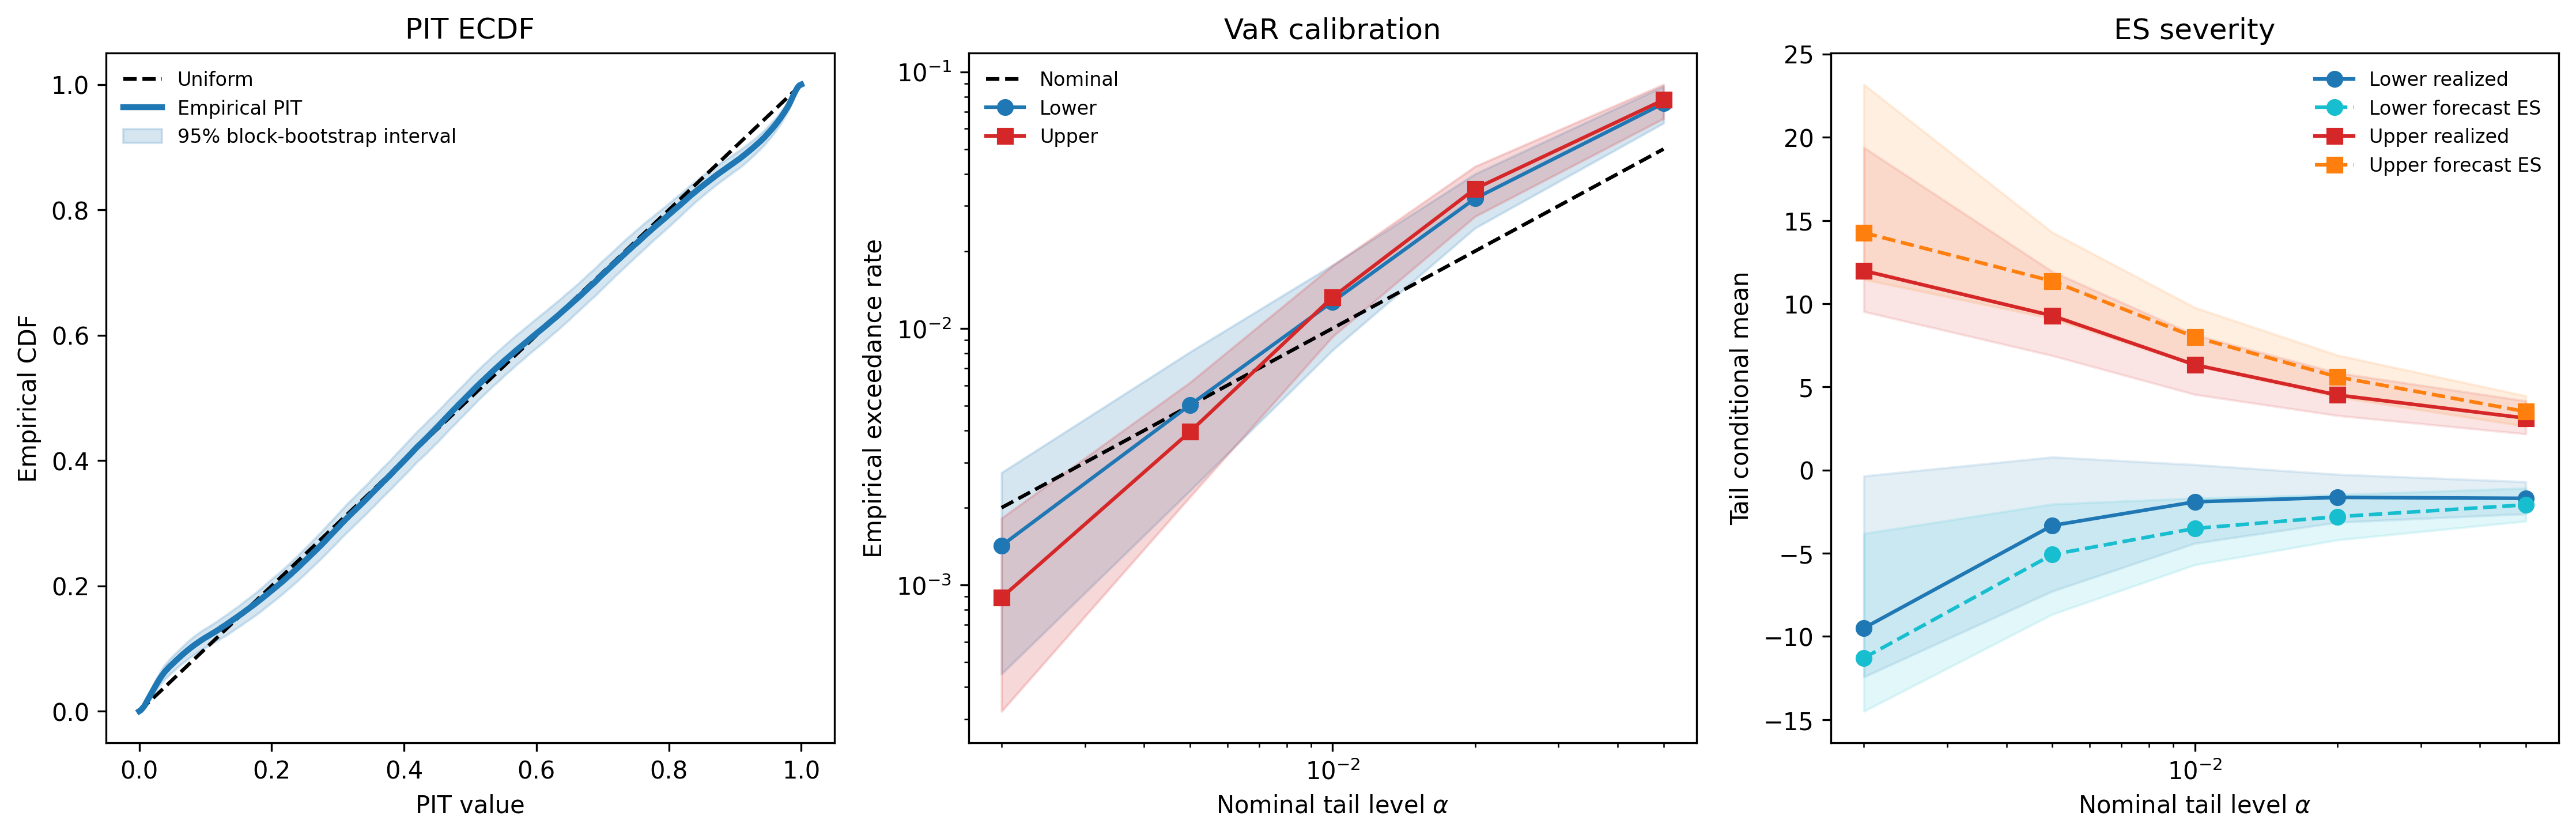
Tail calibration diagnostic plots
| Model | CRPS | twCRPS | twCRPS lower (<-10) | twCRPS upper (>10) | QL 1% | QL 5% | QL 95% | QL 99% |
|---|---|---|---|---|---|---|---|---|
| SAINT | 0.8205 | 0.0665 | 0.0121 | 0.0545 | 0.0706 | 0.2081 | 0.1952 | 0.0611 |
| GARCH | 2.2140 | 0.1060 | 0.0306 | 0.0754 | 0.1123 | 0.3884 | 0.3229 | 0.1057 |
| TimeXer | 0.8787 | 0.0883 | 0.0206 | 0.0677 | 0.0811 | 0.2225 | 0.2062 | 0.0685 |
| TiDE | 0.9702 | 0.0775 | 0.0132 | 0.0643 | 0.1560 | 0.3061 | 0.3009 | 0.1555 |
| ARIMA | 4.4917 | 1.3344 | 0.6747 | 0.6597 | 0.4212 | 1.4877 | 1.4975 | 0.4232 |
| Naive | 5.4997 | 2.1775 | 1.1169 | 1.0607 | 0.5190 | 1.8347 | 1.8347 | 0.5190 |
Full benchmark table
The tail diagnostics plots can be ran from the following notebook (after downloading the forecast artifacts):
./tail_diagnostics.ipynbRun this for reproducing the benchmark tables in the paper:
python ./tables/tables_full_benchmark.py
python ./tables/tables_DM_tests.pyThis Quantlet examines the sparse covariate selection in our forecasting model. The variate selection architecture is a context-aware Gated Residual Network (introduced by Lim et al. in https://arxiv.org/abs/1912.09363) which uses sparsemax activation and entropy regularisation to enforce a sparse representation.
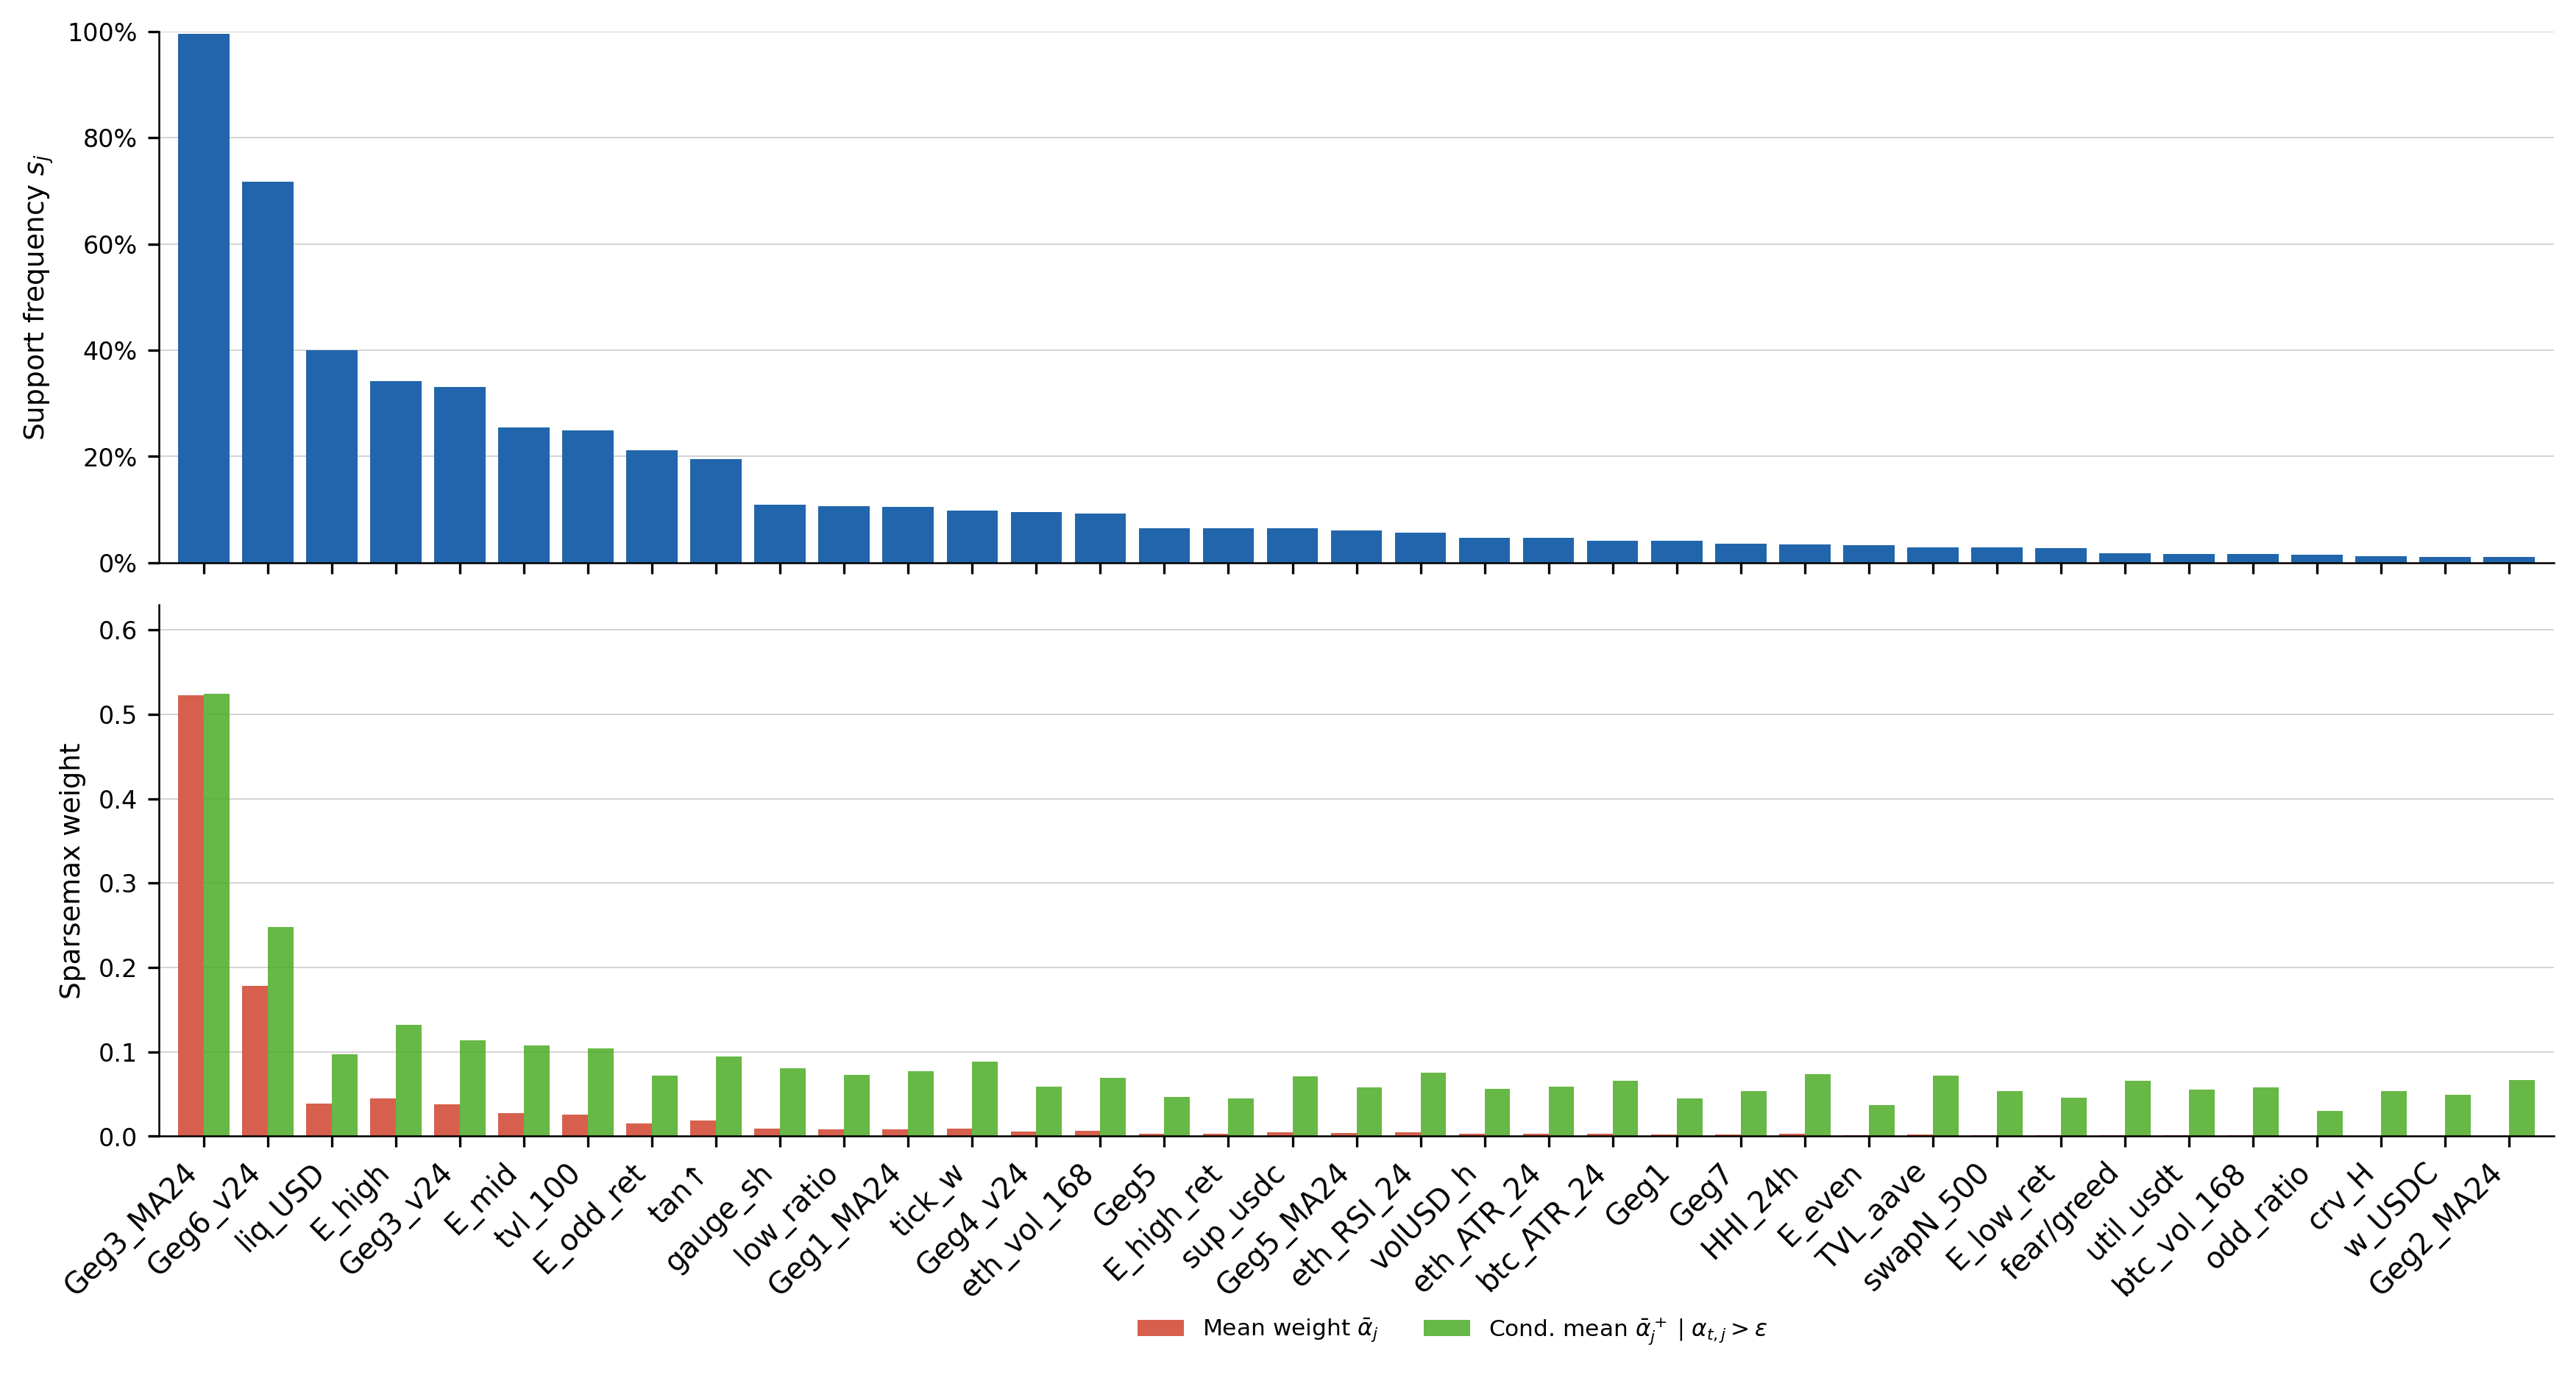
Variate Support Weight
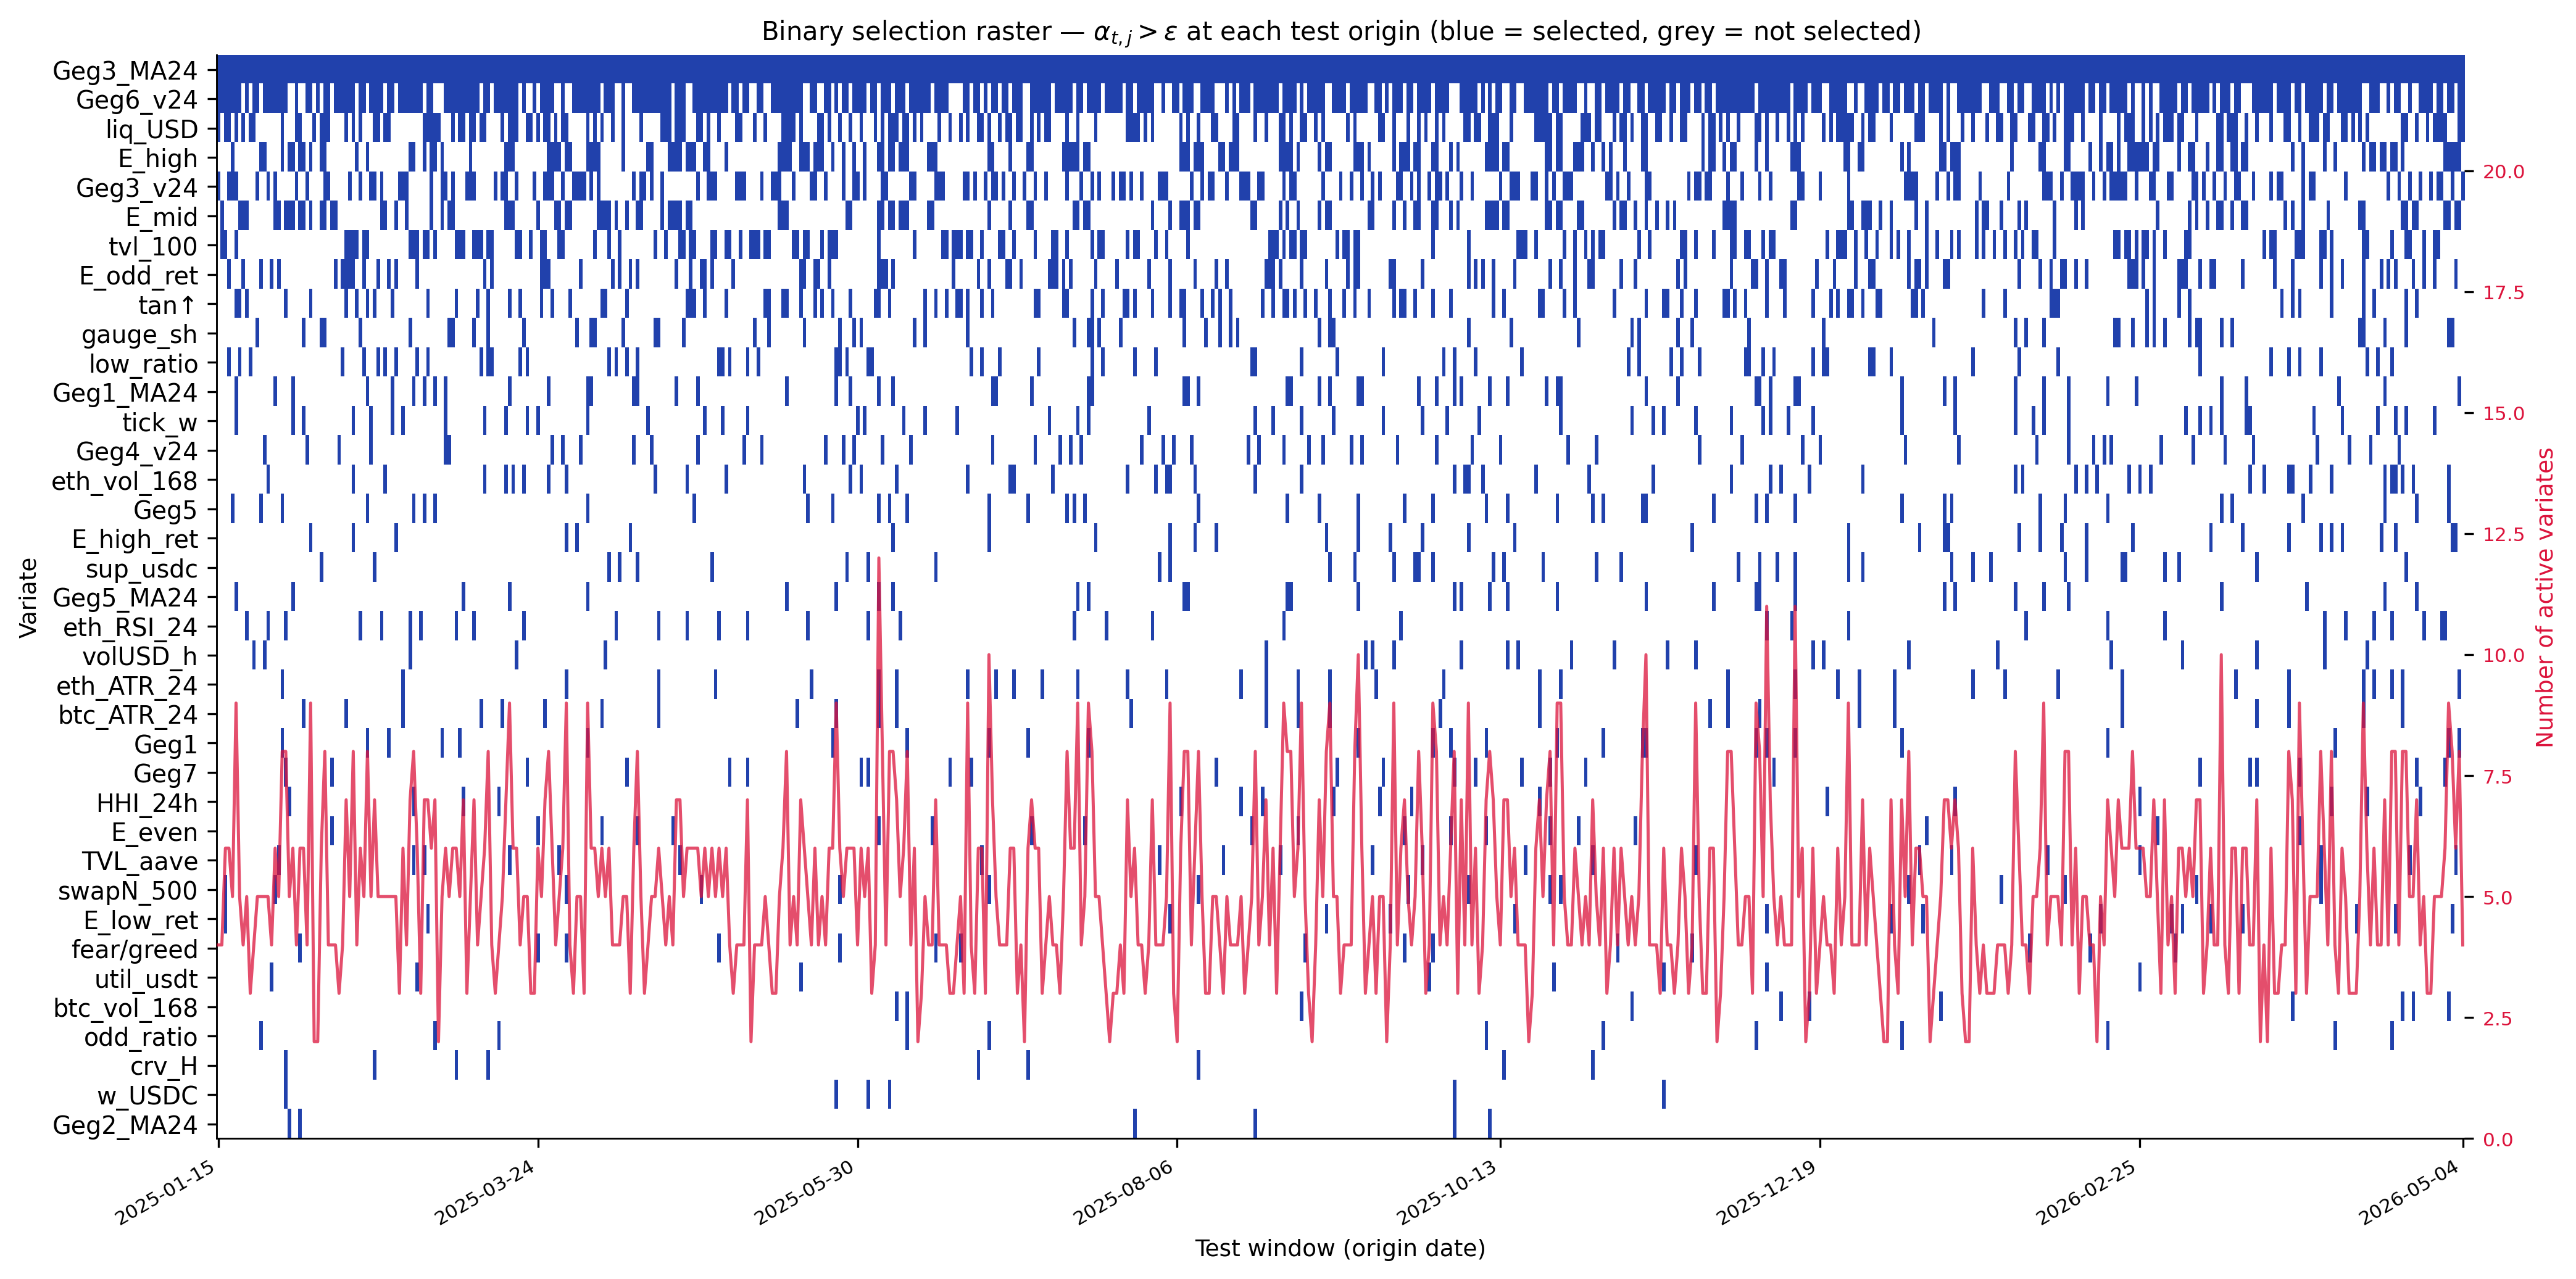
Raster plot of variate selection at test origins
The sparse selection diagnostics plots can be ran from the following notebook (after downloading the forecast artifacts):
13. Sparse Variate Selection/code.ipynbA minimal working copy of the probabilistic forecasting framework used in the paper, built on PyTorch Lightning. It includes the full ANGEL model architecture, all baselines (iTransformer, TimeXer, TSMixer, TiDE, N-BEATS), shared training logic, data loaders, and loss functions. The paper-reported hyperparameters are captured in ready-to-run shell scripts.
See the full setup instructions in the README:
[SUPPLEMENT] Pytorch lightning forecasting repo/README.mdRun ANGEL with the paper hyperparameters:
cd "[SUPPLEMENT] Pytorch lightning forecasting repo"
bash scripts/run_ANGEL.sh