dotnet run --project solutions/MapRunRxSpatial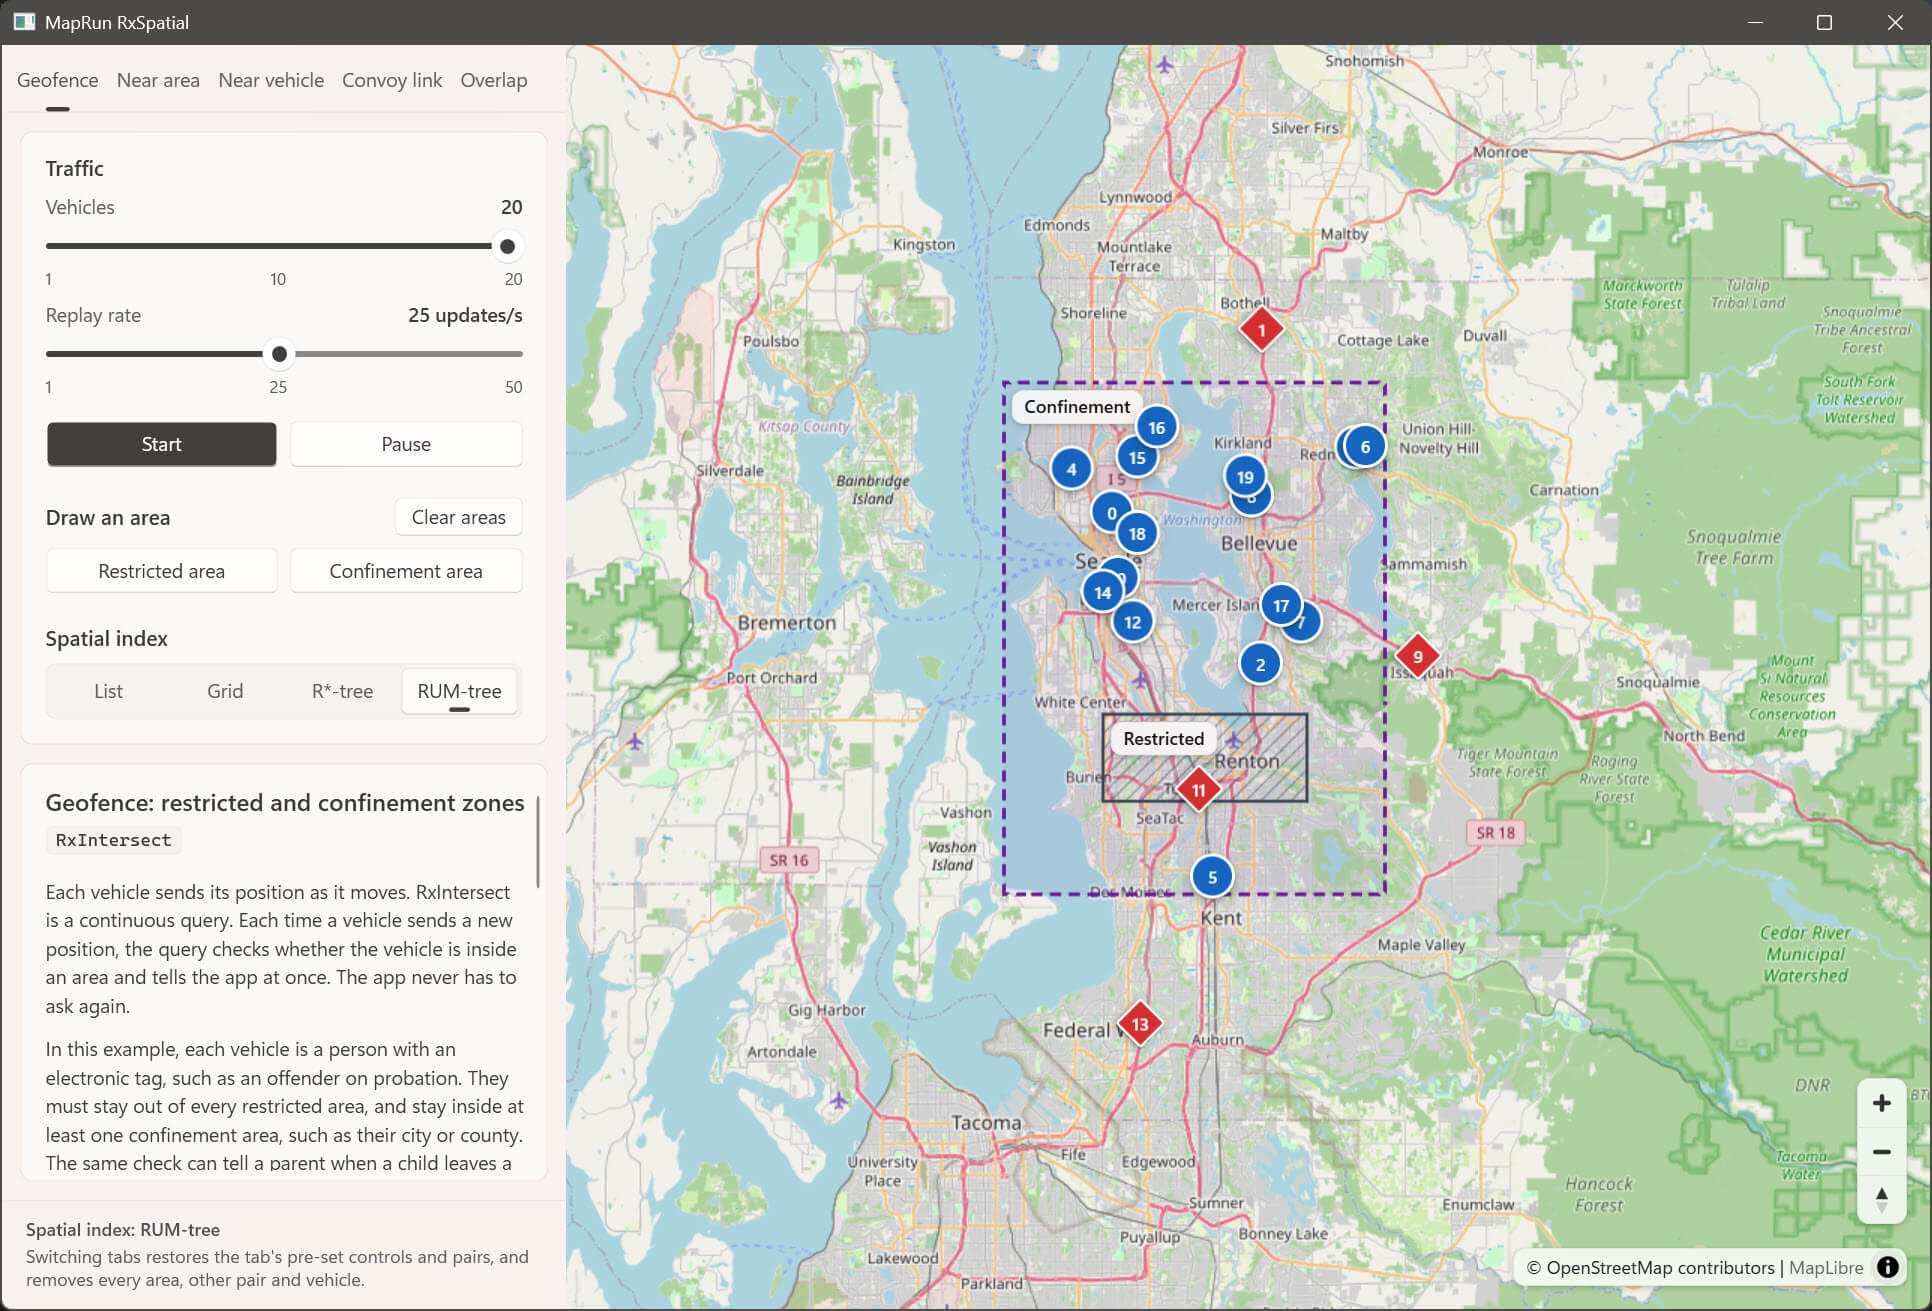
The control panel has one tab per scenario — Geofence (RxIntersect), Near area (RxDistance), Near vehicle (RxRxDistance), Convoy link (RxRxDistance with a connection line) and Overlap (RxRxIntersect, RxRxIntersection and RxIntersection) — and each tab shows its own steps and colour legend. On Geofence, the Spatial index buttons (List, Grid, R*-tree, RUM-tree) switch the index while the demo runs: the vehicles are rebuilt on the new index and the drawn areas stay. The tab starts with, and a tab switch restores, the index set in appsettings.json (the RUM-tree by default). The alerts are the same on every index, because the queries are exact and the index only prunes which observers are evaluated; the papers compare the indexes on throughput and latency at scale (ICDE 2017 Figs. 6, 7 and 12), which 20 vehicles cannot show. The other tabs always use the List index. Spatial pruning would suppress their continuous distance streams, and on Overlap the results that say two reaches no longer overlap or a reach has left a zone. The panel footer shows the index in use.
Each tab starts with the settings of the matching figure in the RxSpatial papers, so pressing Start reproduces it. Nothing moves until you press Start, and switching tabs restores these defaults:
| Tab | Vehicles | Observe distance | Watched pairs | Reproduces |
|---|---|---|---|---|
| Geofence | 20 | — | — | DEBS 2016 Fig. 5 |
| Near area | 20 | 4,600 m | — | DEBS 2016 Fig. 4 (family locator, 4,610.93 m) |
| Near vehicle | 20 (fixed) | 5,000 m | 10–12, 15–16 | SIGMOD 2016 control panel (5,065.43 m); ICDE Fig. 4c pairs |
| Convoy link | 20 (fixed) | 8,000 m | 4–18, 10–12, 7–9 | ICDE Fig. 5 / DEBS 2016 Fig. 3 |
| Overlap | 20 (fixed) | — (Reach: 2,000 m) | 15–16, 10–12, 7–9, 1–17 | DEBS 2016 §3.3 (car pooling, Fig. 3) and §3.1 |
Replay rate is 25 updates/s on every tab. The papers do not give a consistent value (their screenshots show 1, 48 and 56 on a differently scaled slider), so this is a readable middle value. The replay keeps its own clock, so the vehicles really move at the rate the slider shows (up to 50 updates/s); a plain WPF timer, which fires only on Windows' 15.6 ms clock tick, delivered 21 and 32 updates/s for 25 and 50. The papers give no area coordinates, so on the area tabs you draw them: press Add area (on Geofence, Restricted area or Confinement area) and drag a rectangle on the map. The button stays pressed while the map is in drawing mode, which shows a crosshair and a hint; the drag draws instead of panning, while the mouse wheel and the +/- buttons still zoom. Esc, a right-click or pressing the button again cancels. Outside drawing mode the map pans and zooms as usual, and clicks do nothing. Geofence has both kinds of zone from the restricted/confinement zone alert of ICDE 2017 Fig. 4a: an offender must stay out of every restricted area (slate hatching) and inside a confinement area (purple dashed outline) (a city or county; the DEBS 2016 §3.4 family locator's designated region for a child). Being inside any one confinement area is enough. The pre-set pairs are watched as soon as their vehicles appear after Start. To watch more pairs, choose a First vehicle and a Second vehicle and press Watch pair. On Near vehicle, Watch all pairs watches all 190 pairs: the self-join RxRxDistance of ICDE 2017 §V.B, which continuously evaluates the distance between every pair of cars (380 observers, because each pair is watched from both ends). Each vehicle then shows the colour of its nearest other vehicle. Convoy link does not offer this, because 190 connection lines would be unreadable. Clear pairs removes every pair, the pre-set pairs too, until the next tab switch.
The Convoy link figure shows 9,935 m. On the recorded trajectories, pair 4–18 is beyond that distance only for the first few updates, so it would turn green almost at once. At 8,000 m, the pairs stay in the states the figure describes for most of the replay: 4–18 is gray (beyond the limit) 53% of the time, 10–12 is yellow (stable) 94% of the time, and 7–9 is green (near the limit) more often than any other colour (40%).
Overlap shows the three intersection queries that the other tabs do not use. On this tab each vehicle pushes its reach instead of a bare point: new GeoCircle(position, reach), an exact disc with the Reach radius (250 m to 3 km). The queries therefore compare regions. The marker stays at the vehicle's own position, and each reach is drawn as a thin slate circle through the vertices GeoOperations.ToVertices places on that same circle. The map zooms to the recorded trajectories so that a reach is wider than a marker, and returns to the default view when you leave the tab.
- Car pooling (DEBS 2016 §3.3: "the developer could easily use the RxRxIntersection observer … If the intersection is small till these cars reach their destination like 15 and 16, these cars could car pool"). Each watched pair has an
RxRxIntersectquery, which turns both markers green while their reaches overlap, and anRxRxIntersectionquery. Its result, the lens, is drawn from the vertices of theGeoPolygonthatGeoOperations.Intersectionreturns, and labelled with its exact area (GeoOperations.Area) in km². - Friends in a region (DEBS 2016 §3.1: "find all my friends in Seattle downtown"). Press Add zone and drag a rectangle. An
RxIntersectionquery gives each vehicle the part of its reach inside the zone, which is shaded.
The papers give no reach, so the default comes from the recorded trajectories. At 2,000 m, pair 15–16 overlaps for the whole replay, 10–12 for 90% of it, 7–9 for 24% and 1–17 for 16%; about 11 of the 190 pairs overlap at any moment. The figure's fifth pair, 4–18, is left out, because those vehicles always stay more than 6 km apart. Watch all pairs watches all 190 pairs with RxRxIntersect only, without lenses, because 190 lenses would cover the map. (With SQL Server's 128-gon discs, intersecting 380 pairs took about 40 ms a tick and halved the replay speed; RxSpatial.Geo tests two exact discs in about 23 ns.) Clear pairs and Clear zones each remove only their own kind.
Colours, where d is the observe distance (a vehicle in several queries shows its most urgent colour):
| Colour (marker shape) | Area tabs (vehicle vs area) | Pair tabs (vehicle vs vehicle; Convoy link line) |
|---|---|---|
| Blue (circle) | No alert: outside every restricted area (and inside a confinement area, if any), or farther than d from an area | Not watched |
| Gray (dashed ring) | — | Watched, farther apart than d (dark dotted line) |
| Green (rounded square) | Within d | Within d, near the limit (thin line) |
| Yellow (triangle) | Closer than 4/7 d | Closer than 4/7 d: stable working distance (thick line) |
| Red (diamond) | Inside a restricted area, or outside every confinement area | Closer than 1/7 d: the minimum safe distance is breached (thickest line) |
On Overlap, a watched vehicle is gray (dashed ring) while its reach overlaps no watched partner, and green (rounded square) while it overlaps at least one. The map overlays on that tab are:
| Overlay | Meaning |
|---|---|
| Thin slate circle | A vehicle's reach |
| Teal dot pattern with a solid teal outline, and an area label | The lens: where the reaches of a watched pair overlap (RxRxIntersection) |
| Brown outline, labelled Zone | A zone that you drew |
| Brown back-diagonal hatching | The part of a vehicle's reach inside a zone (RxIntersection) |
Accessibility: the panel meets WCAG 2.2 AA contrast (4.5:1 text, 3:1 control states) in the Fluent light theme, whatever the Windows accent colour (a light accent is replaced with a dark blue). Marker state does not rely on colour alone: each state has its own marker shape (blue circle, gray dashed ring, green rounded square, yellow triangle, red diamond), every area and overlay has its own pattern or outline, and the legends draw and name the same shapes. Drawing an area needs a mouse drag; every other control works from the keyboard and has an accessible name.