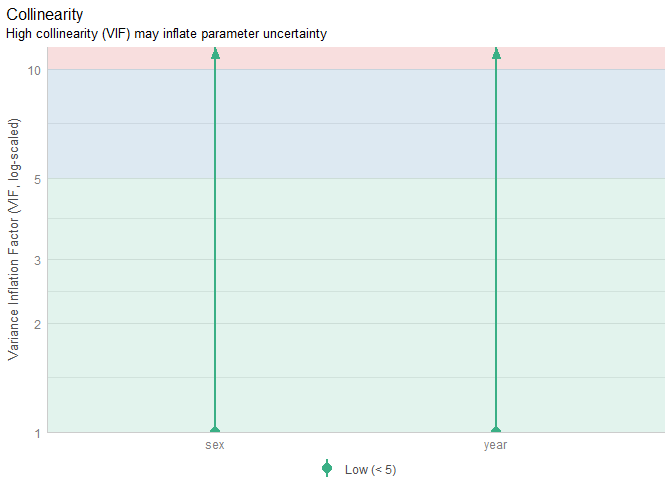
While teaching with easystats, I am finding many students are getting confused and misled by the visualization of infinite confidence intervals around VIF. Quite a few every semester write up something like, "given the arrows extending above 10, multicollinearity is indicated." Could the infinite ones just be hidden?
library(easystats)
#> # Attaching packages: easystats 0.7.4
#> ✔ bayestestR  0.16.0   ✔ correlation 0.8.7
#> ✔ datawizard  1.1.0    ✔ effectsize  1.0.0
#> ✔ insight     1.3.0    ✔ modelbased  0.11.0
#> ✔ performance 0.14.0   ✔ parameters  0.26.0
#> ✔ report      0.6.1    ✔ see         0.11.0
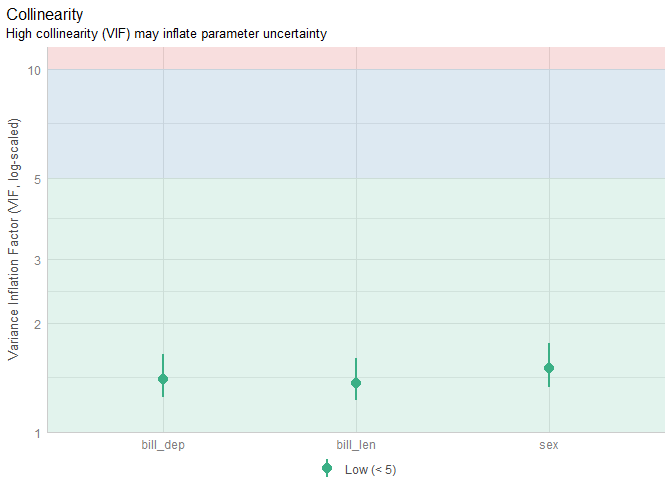
Working Well
fit <- lm(body_mass ~ 1 + sex + bill_len + bill_dep, data = penguins)
(cc <- check_collinearity(fit))
#> # Check for Multicollinearity
#>
#> Low Correlation
#>
#>      Term  VIF   VIF 95% CI adj. VIF Tolerance Tolerance 95% CI
#>       sex 1.50 [1.33, 1.76]     1.22      0.67     [0.57, 0.75]
#>  bill_len 1.36 [1.22, 1.60]     1.17      0.73     [0.63, 0.82]
#>  bill_dep 1.40 [1.25, 1.64]     1.18      0.72     [0.61, 0.80]
plot(cc)
Confusing to Students
fit2 <- lm(body_mass ~ 1 + sex + year, data = penguins)
(cc2 <- check_collinearity(fit2))
#> # Check for Multicollinearity
#>
#> Low Correlation
#>
#>  Term  VIF  VIF 95% CI adj. VIF Tolerance Tolerance 95% CI
#>   sex 1.00 [1.00, Inf]     1.00      1.00     [0.00, 1.00]
#>  year 1.00 [1.00, Inf]     1.00      1.00     [0.00, 1.00]
plot(cc2)
Created on 2025-05-23 with reprex v2.1.1
While teaching with easystats, I am finding many students are getting confused and misled by the visualization of infinite confidence intervals around VIF. Quite a few every semester write up something like, "given the arrows extending above 10, multicollinearity is indicated." Could the infinite ones just be hidden?
Working Well
Confusing to Students
Created on 2025-05-23 with reprex v2.1.1